# How to Compare Shares of Different Dimensions
If you want to see the percentage of new users from a certain media source in the total, you can do Single-event Filtering by using filtering criterion [channel is app store] for the numerator. You can also copy multiple analysis metrics and compare the percentage of each source at the same time.

If you want to compare based on more than one dimensions, you can also use "Event Breakdown" feature to compare the proportion of each dimension following the same logic behind Group by. Event Breakdown only supports breakdown based on event properties. The event property that can be used for breakdown for multiple events is a shared event property.

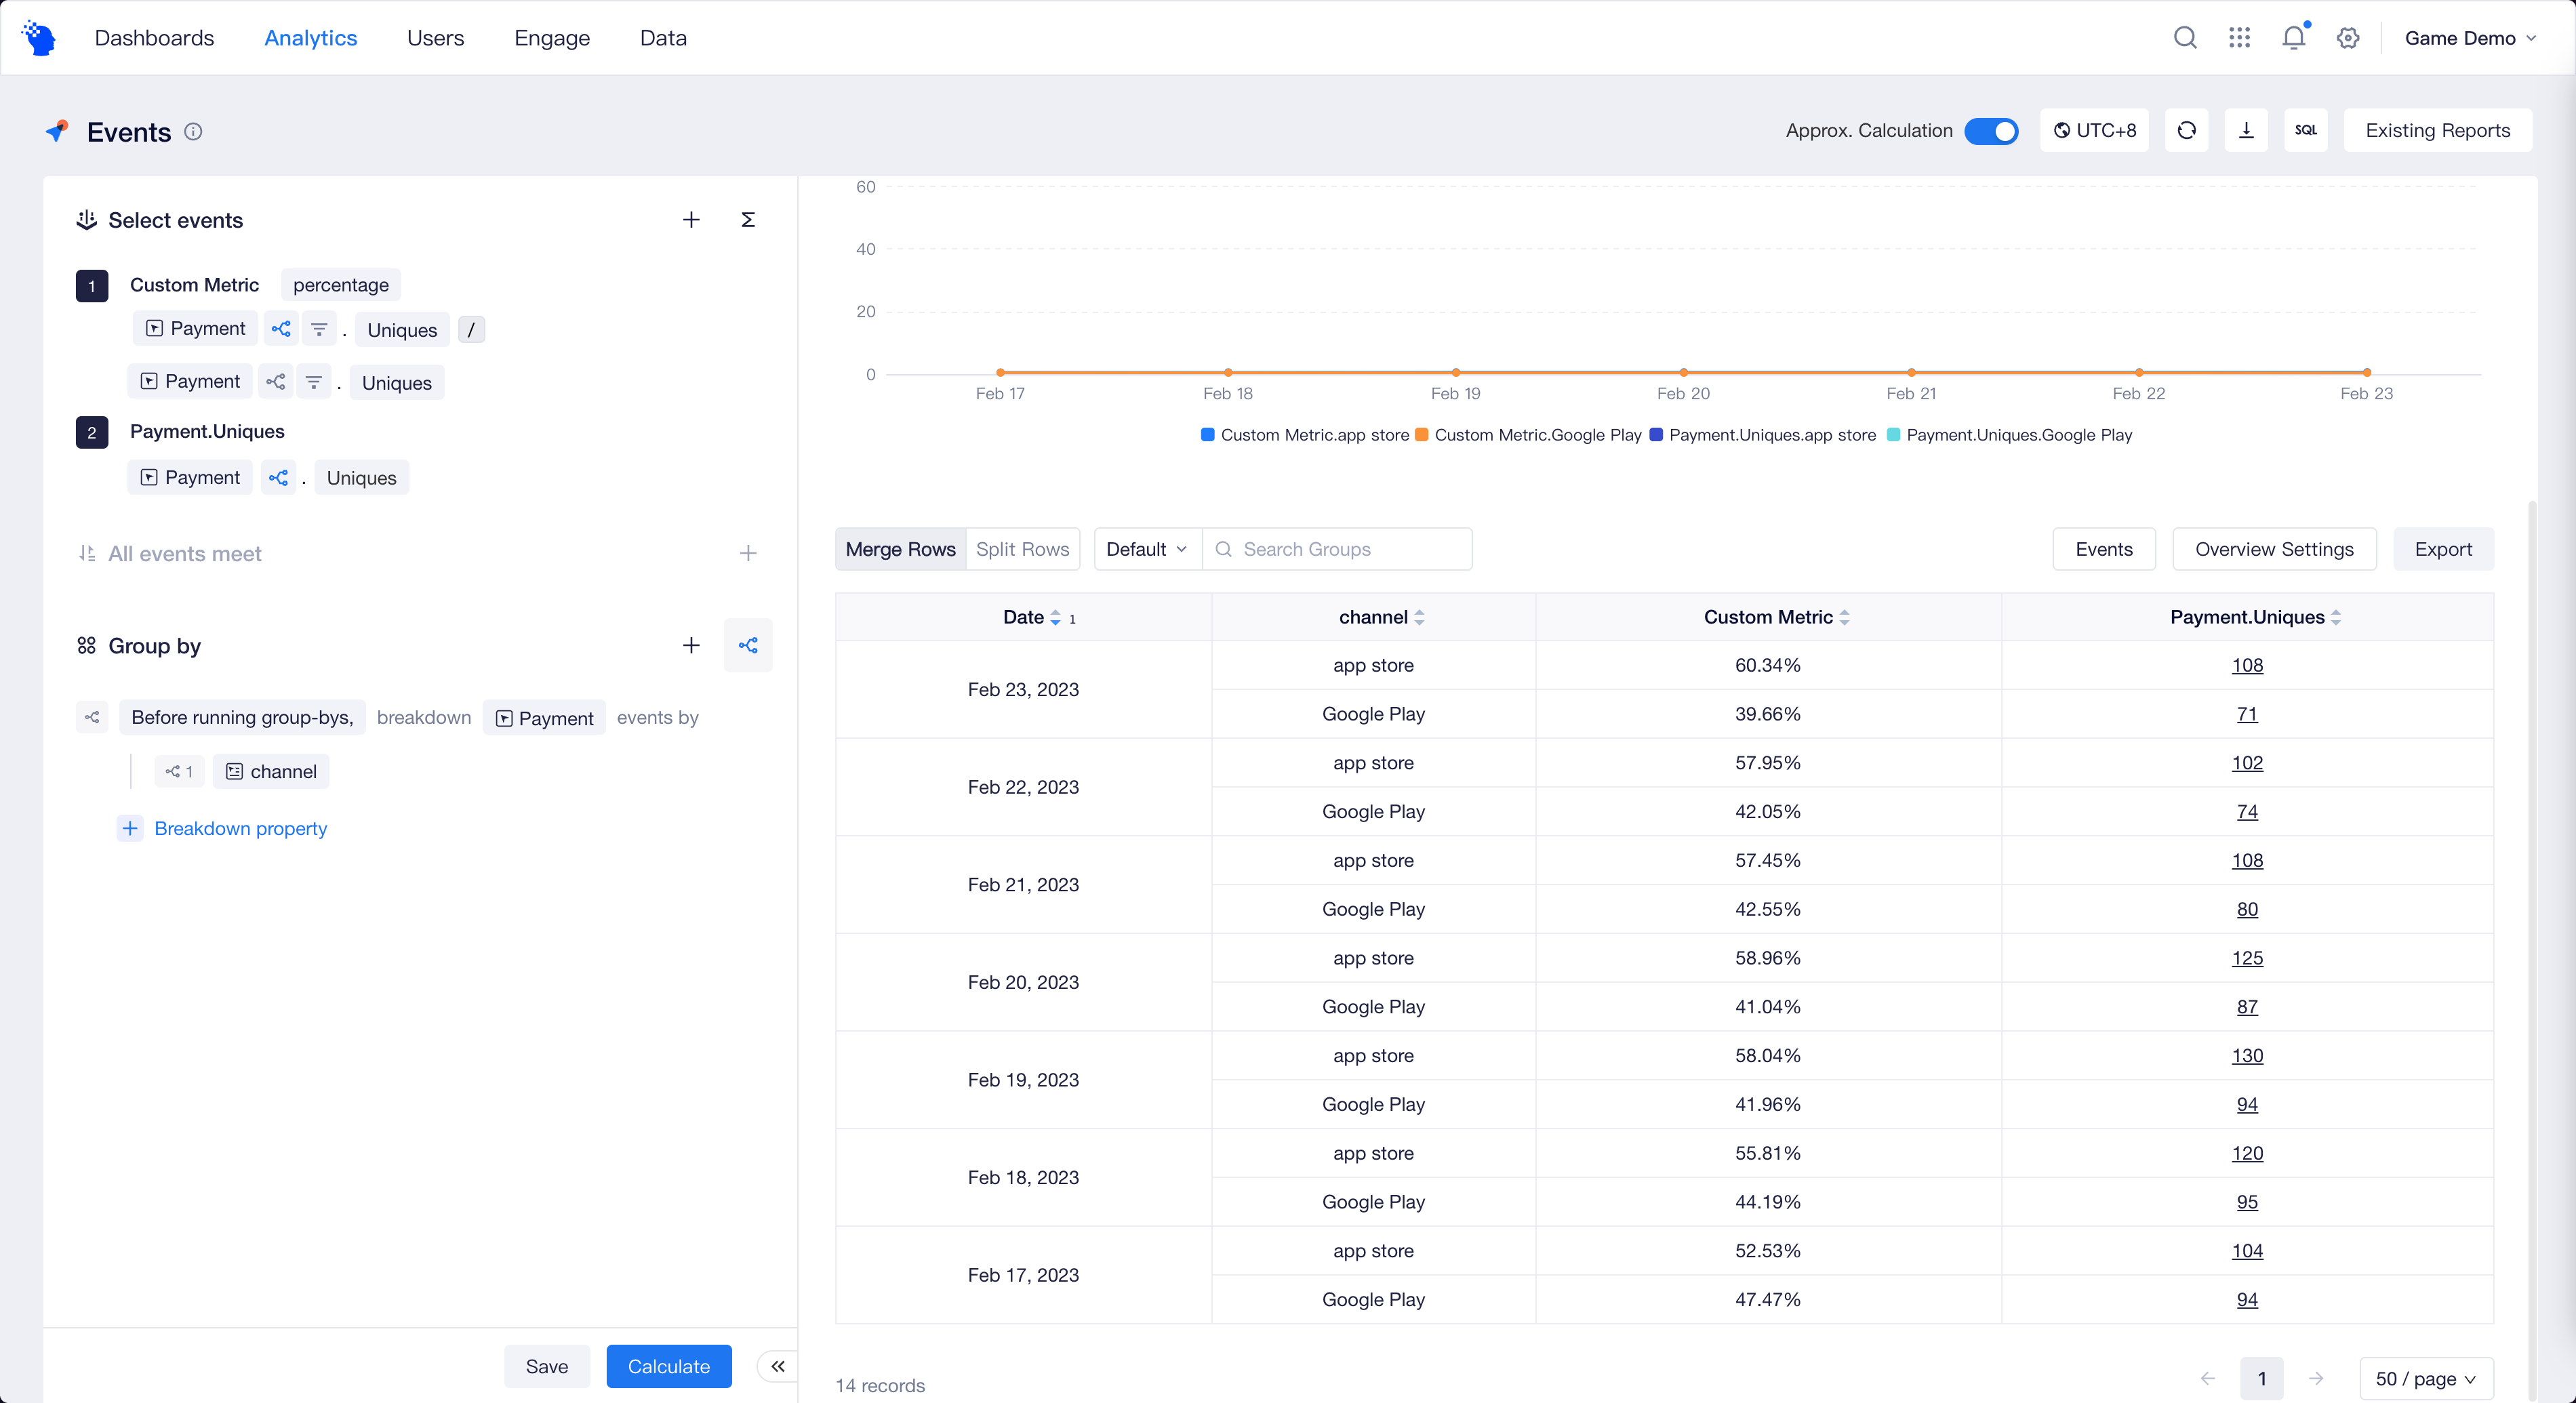
Unlike "Group by" valid for all events, Event Breakdown can specify scope of effect. If you want to compare the share of new users across all sources, you can do so only for the numerator. You can also add another analysis metric to see the number and percentage of registrations from each source.
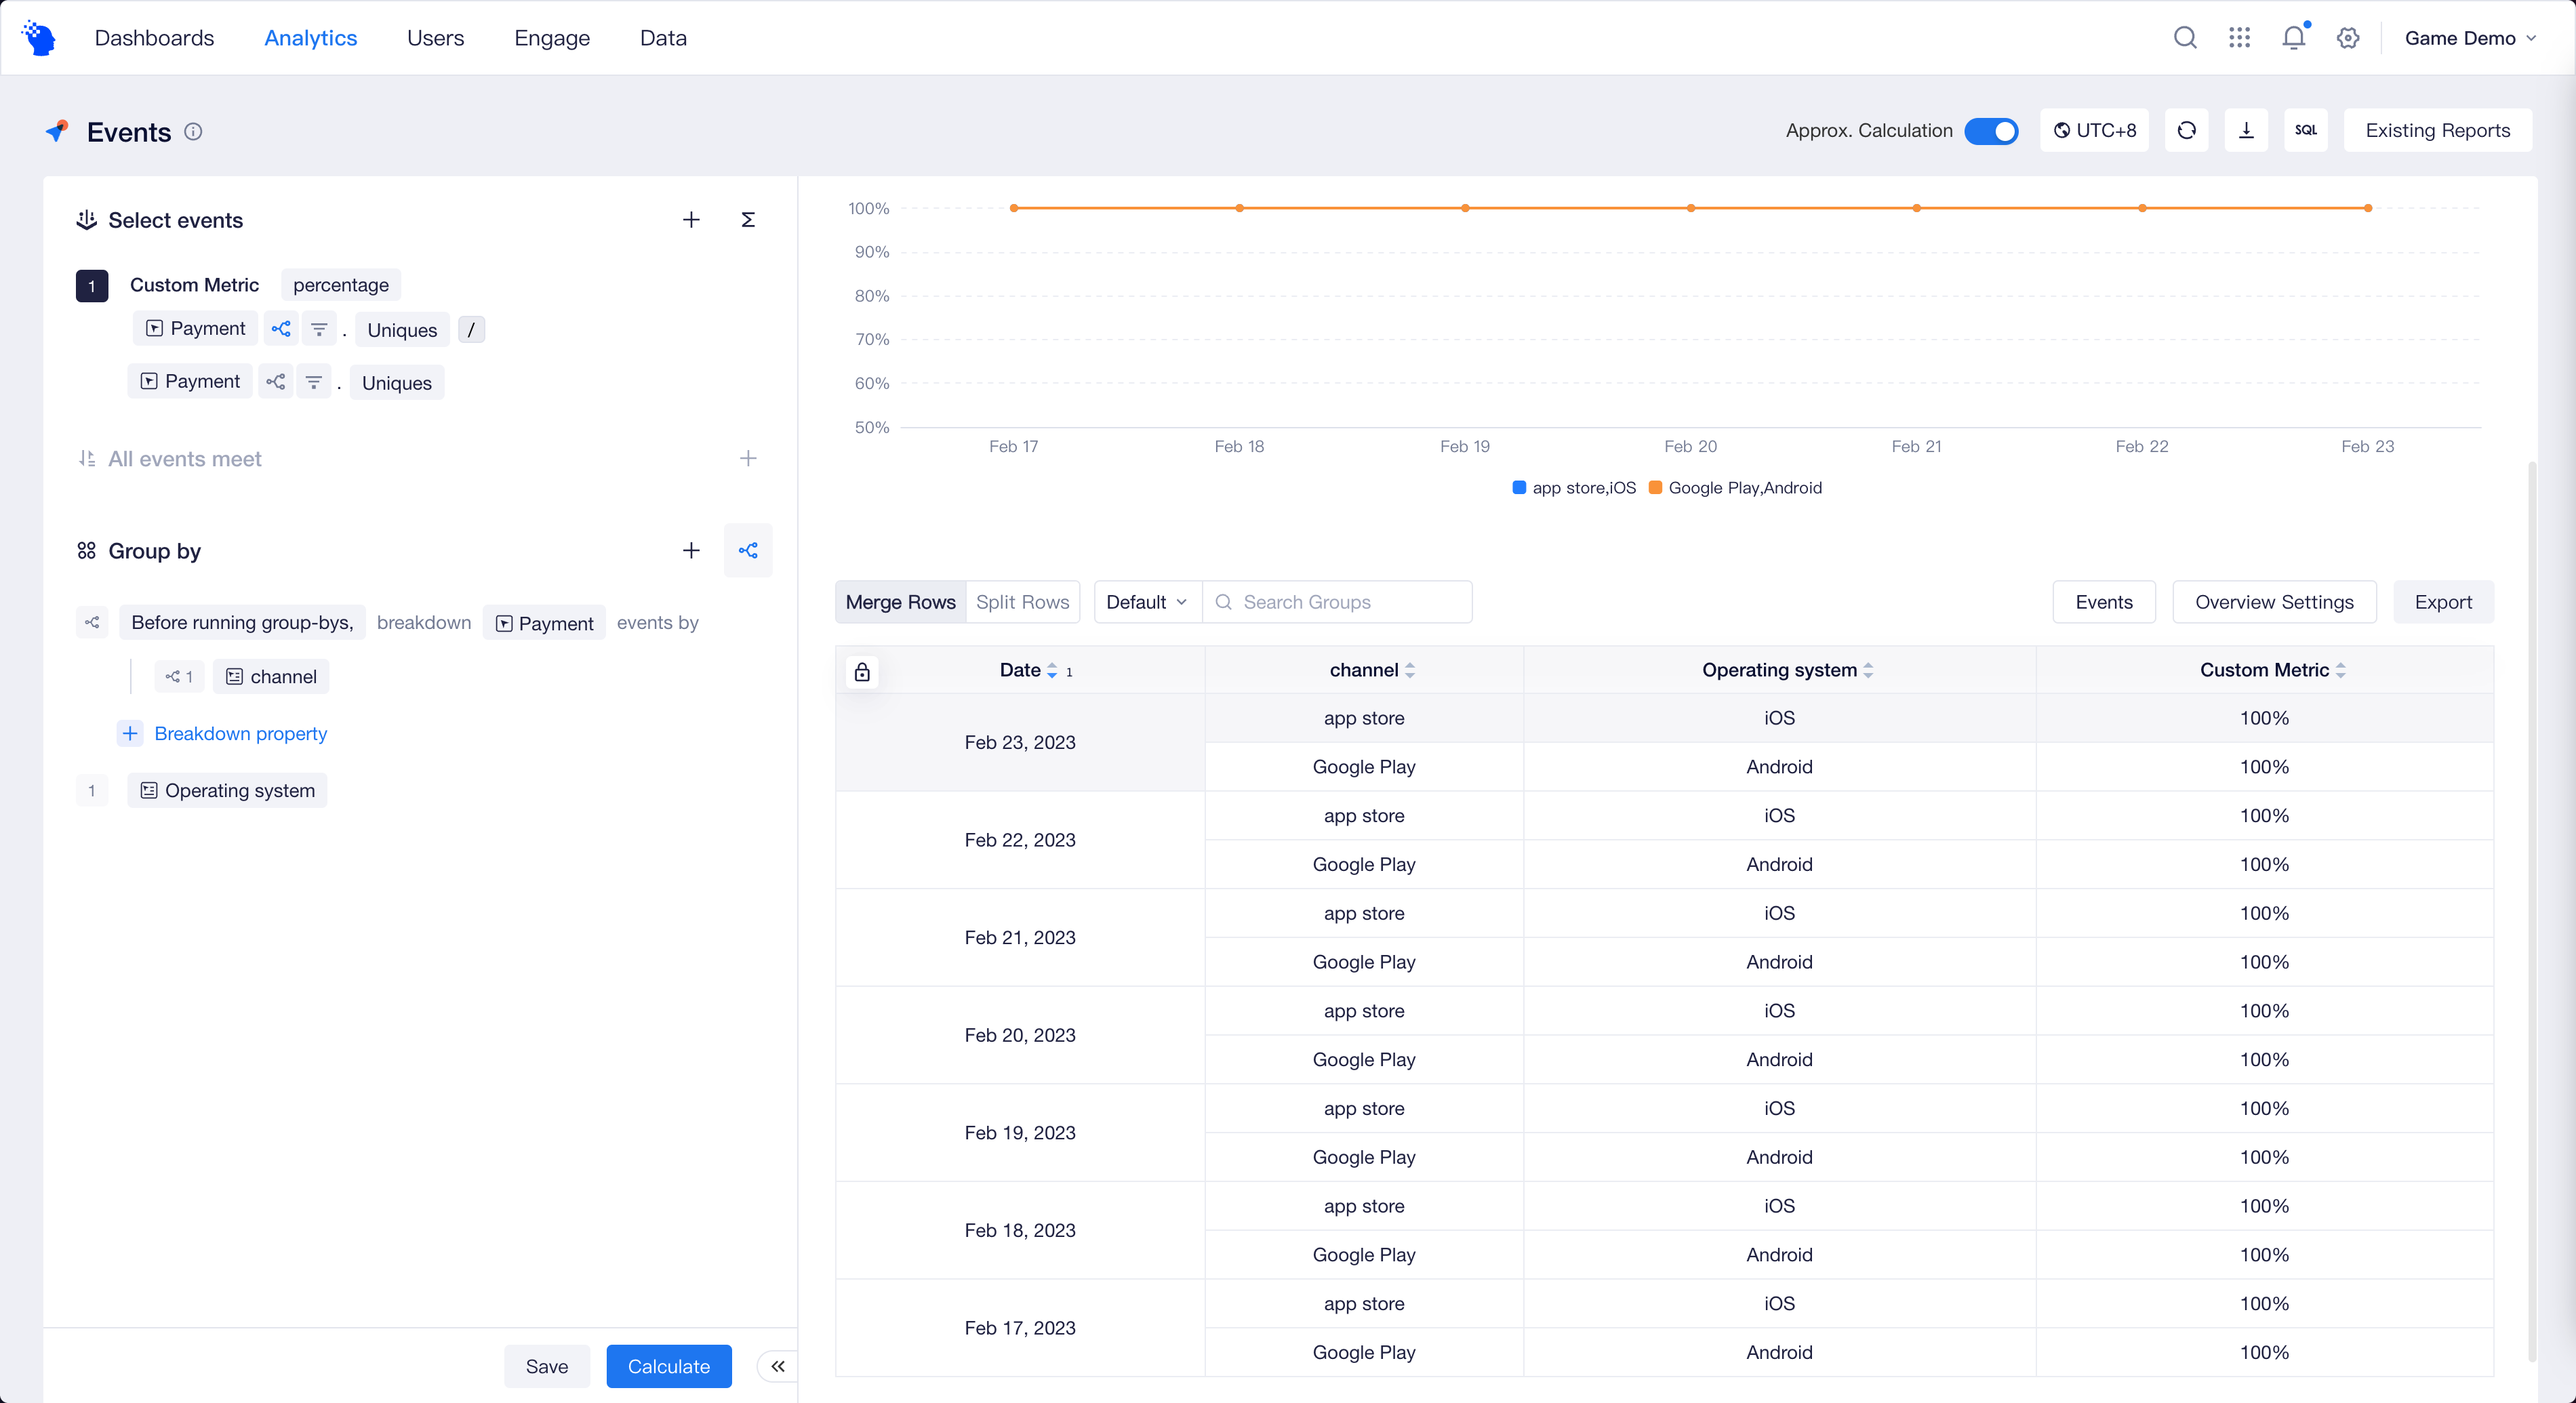
If you want to compare dimensional data with cascading relationship, such as the proportion of sources for a specific operating system, you can use both Event Breakdown and Group by. By default, the subgroup value corresponding to the property for breakdown "Before running group-bys". You can adjust to display the property for breakdown in the "After running group-bys" column or row.