# How to Customize Table Display
Tables are convenient tools to display specific values of analysis metrics. In TE, you can customize them as needed.
# Table Styles
The default table style is "Date > Ascending", with data of different dates being displayed in an ascending date order and each date corresponding to a column in the table. If you want to see the data of the latest date first, you can adjust the table style to "Date > Descending".

In addition to table with data sorted "Date", you can also view data by "Event". In this type of table, rows and columns are transposed when compared to the default table style, each analysis metric corresponds to a column in the table, and each row represents the data of one date.

If you use "Group by" or "Event Breakdown", you can also select "Groups" to display data with subgroup values as table headers. The default sorting method of "Groups" tables have data sorted by the Period Total of the first analysis metric in a descending order. You can switch to sort by subgroup value in an ascending or descending dictionary order.

When displayed in a "Groups" table in the dashboard, you can also select to display the date outside the table for easier date switch and comparison between subgroups.

# Display and Multiple-level Sorting
For easier reading, by default, the table is displayed with "Merge Rows" and you can sort a specified column. Or, you can switch to "Split Rows" display, then you can sort the data at multiple levels according to the order in which you click on the header metrics.

When "Group by" is used in Events, you can choose "Layered" display. All of the group values can then be rolled up or drilled down.
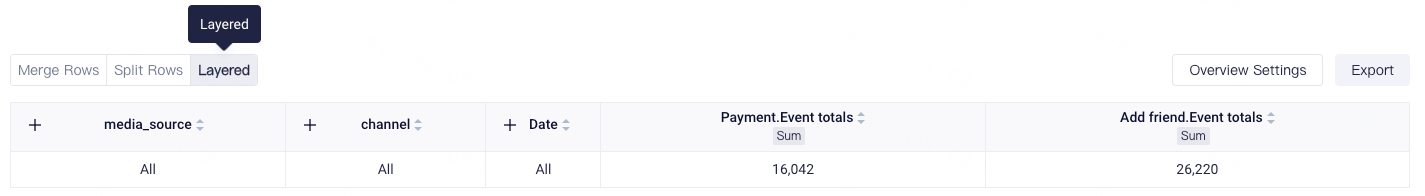
When some group is drilled down, you can also sort the data at multiple levels.

TIP
"Layered" display can not be applied when the report involves retention metrics or event breakdown.
# Overview Settings
When a non-total analysis granularity is selected, Event Analysis will automatically calculate period total for analysis metrics. You can click "Overview Settings" to select the appropriate Period Total calculation method for each analysis metric. Then, in addition to the data of different dates, the overview results will be calculated and displayed based on the data of each date.
If you do not need to show Overview Settings, you can uncheck this option.
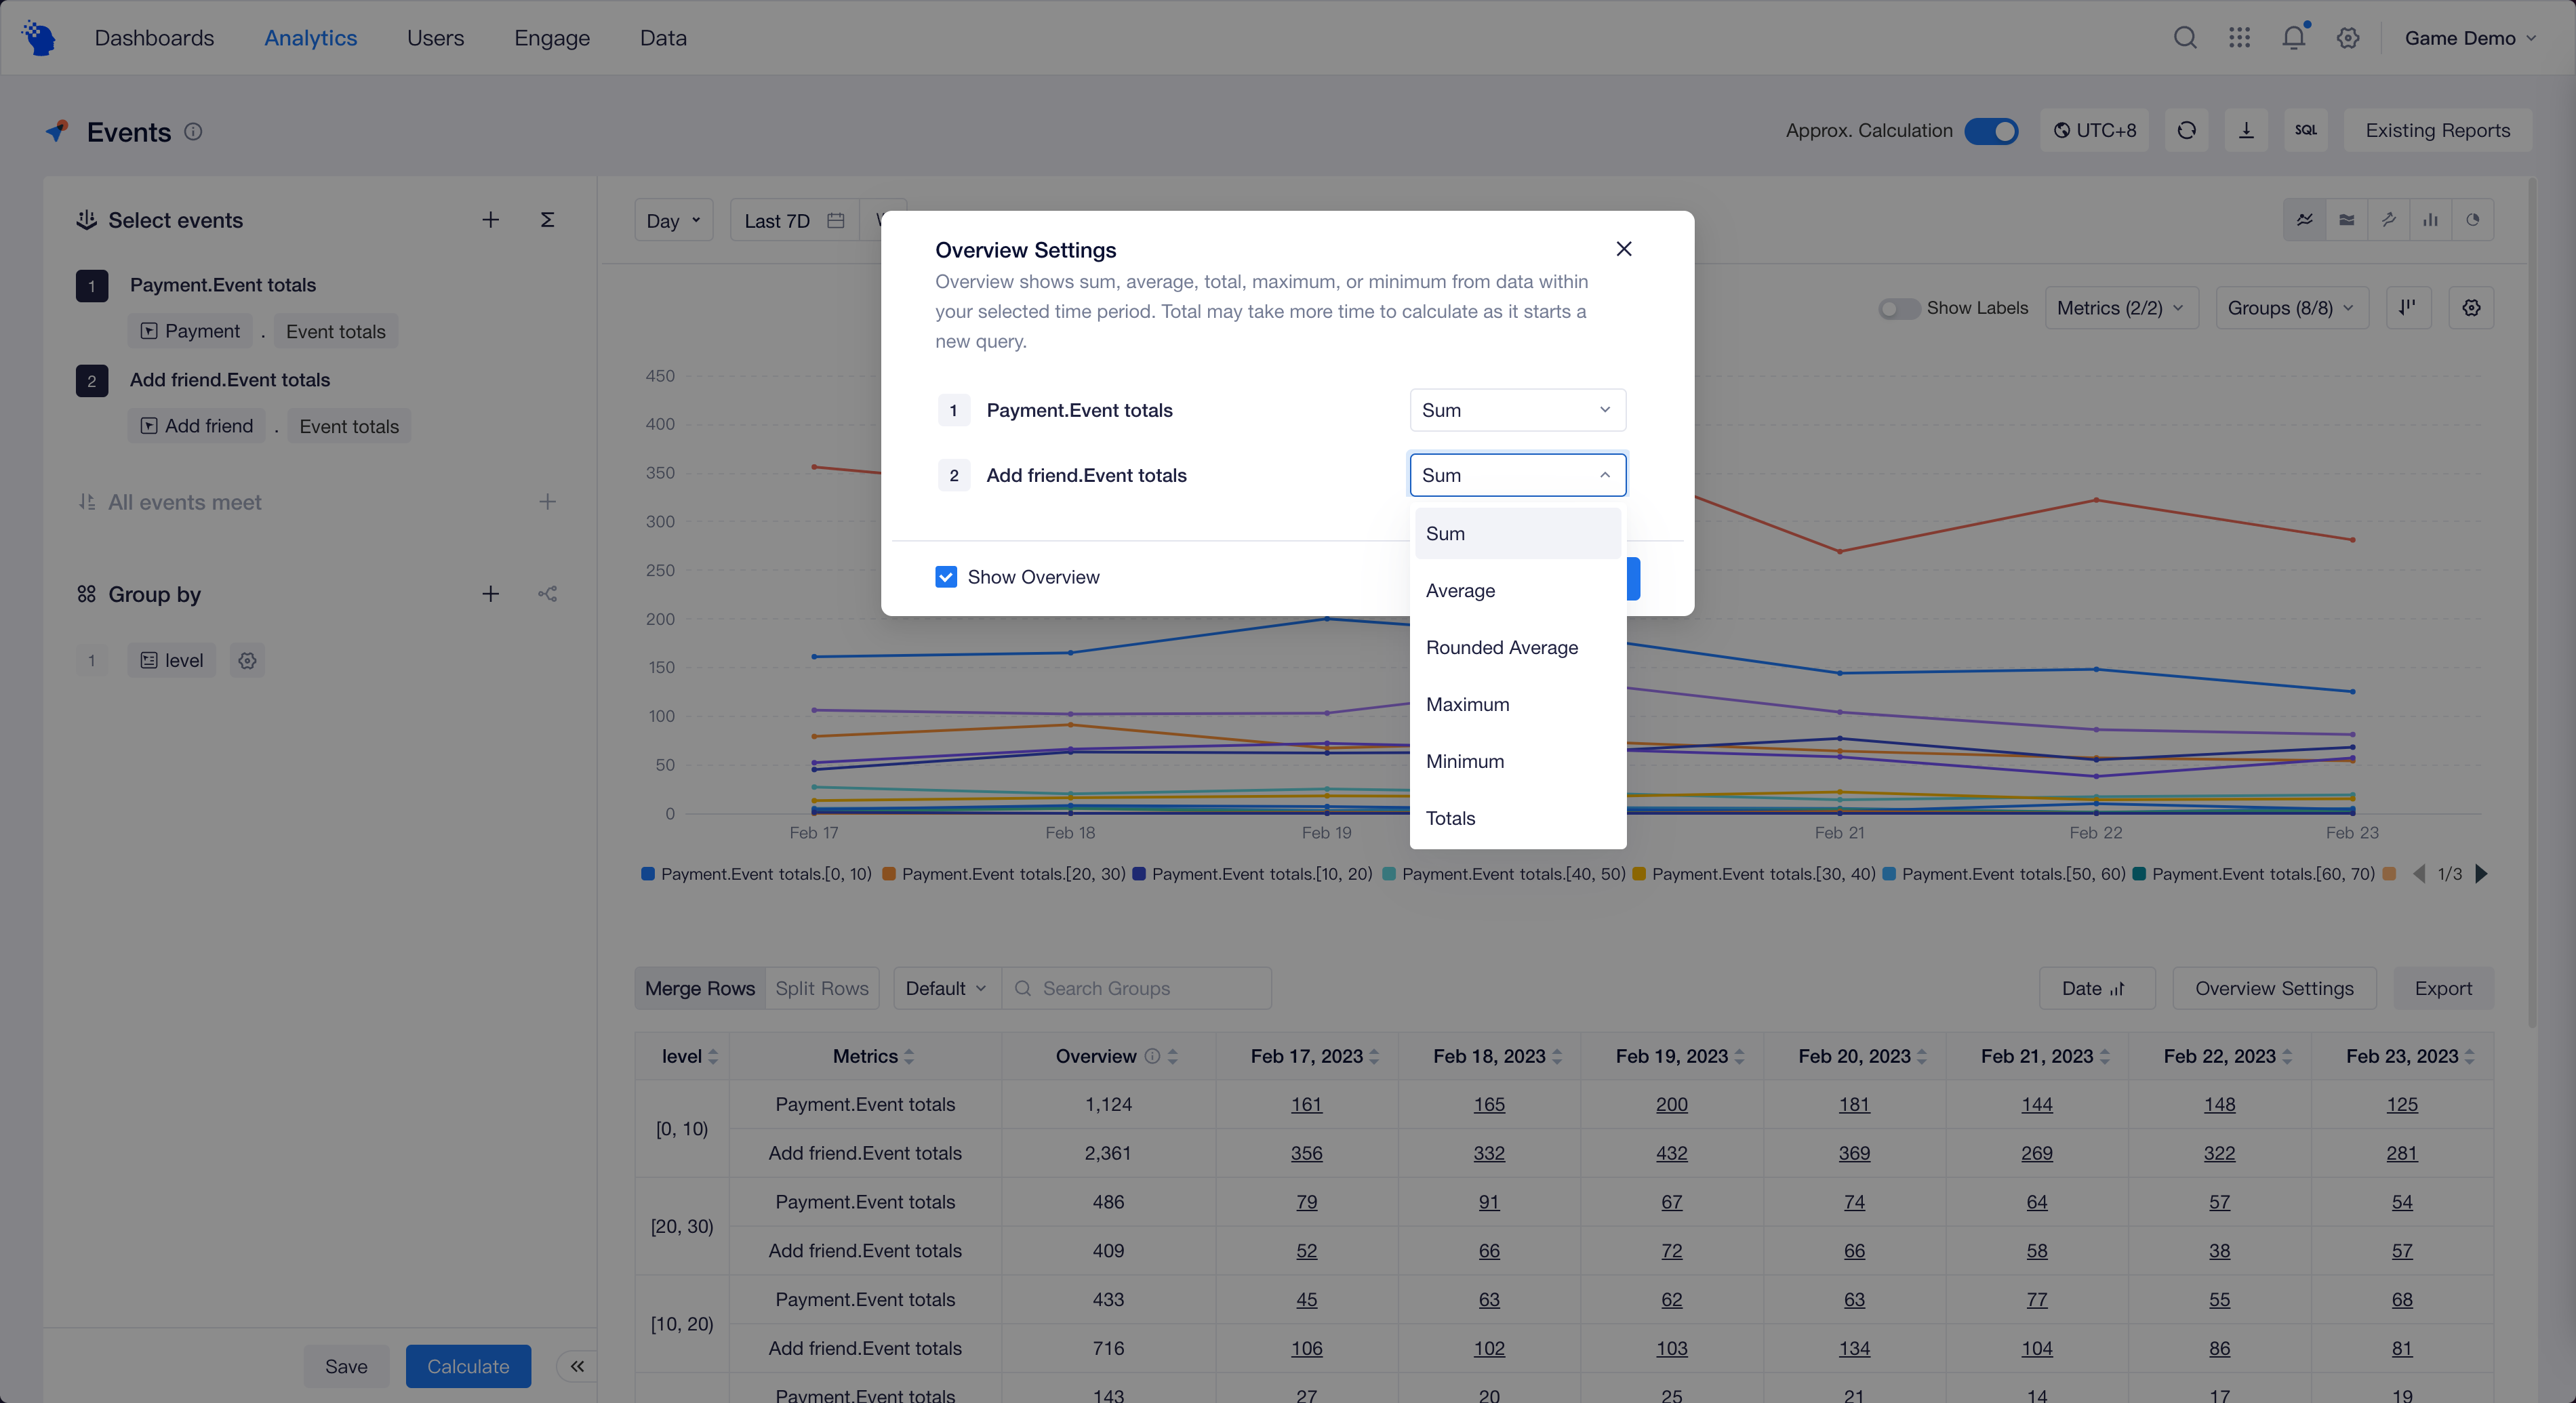
The calculation methods for Overview Settings:
- Sum: Applicable to Event total metrics or Sum metrics. Calculates addition based on the metric values from each date.
- Average (Rounded Average): Applicable to Event total metrics or Sum metrics. Calculates simple average (rounded) based on the metric values from each date.
- Weighted Average:Applicable to per user metrics or division formula metrics. Values of the numerator and the denominator are calculated based on all data throughout the period.
- Maximum: the maximum value among the values of each date.
- Minimum: the minimum value among the values of each date.
- Totals: Applicable to deduplication metrics. Totals are calculated based on the complete time range, and take longer to calculate. Please select cautiously.
Compared to "Average", "Weighted Average" is a better representation of the overall situation. For example, the data for 1st, 2nd, 3rd are as follows:
| 1st | 2nd | 3rd | |
|---|---|---|---|
| Active Number | 100 | 200 | 500 |
| Pay Number | 10 | 30 | 100 |
| Pay Rate (Pay Number/Active Number) | 10% | 15% | 20% |
Average = (10%+15%+20%)/3 = 15%
Weighted Average = (10+30+100)/(100+200+500) = 17.5%
The calculation of "Weighted Average" can also be understood as:
10% * 100/(100+200+500) + 15% * 200/(100+200+500) + 20% * 500/(100+200+500).
You can also obtain more accurate Overview results by "Exclude Incomplete Dates", because the results of this part of the data cannot represent actual performance. For example, when viewing the data at 12:15 on January 1, 2023, if the selected time granularity is "Day", the 1st is an incomplete date; if "Hour" is selected, 12:00, 13:00...23:00 are all incomplete dates.
It should be noted that if you use Retention Metrics, the caliber of incomplete dates will be consistent with the stage value logic of the retention analysis model. When viewing the data on the 3rd, Day0 retention number on the 3rd, Day1 retention rate on the 2nd and 3rd, and LTV-3 on the 1st, 2nd, and 3rd will be considered as incomplete date data and will be excluded in the Overview.