# Visualization Module
The visualization module of TE provides an array of data processing and presentation capacities. You may use the visualization module to add interactive charts to query results and save them as reports that can be viewed from dashboards.
Presently, the visualization module is only provided by the SQL query module.
# Add visualized charts
Click "New Chart" on the SQL query page to access the visualization configuration page.

# Configure chart field
After selecting the chart type, drag and drop the result field under the "Data" tab to dimension or metric configuration area in order to view the display effect of the chart.
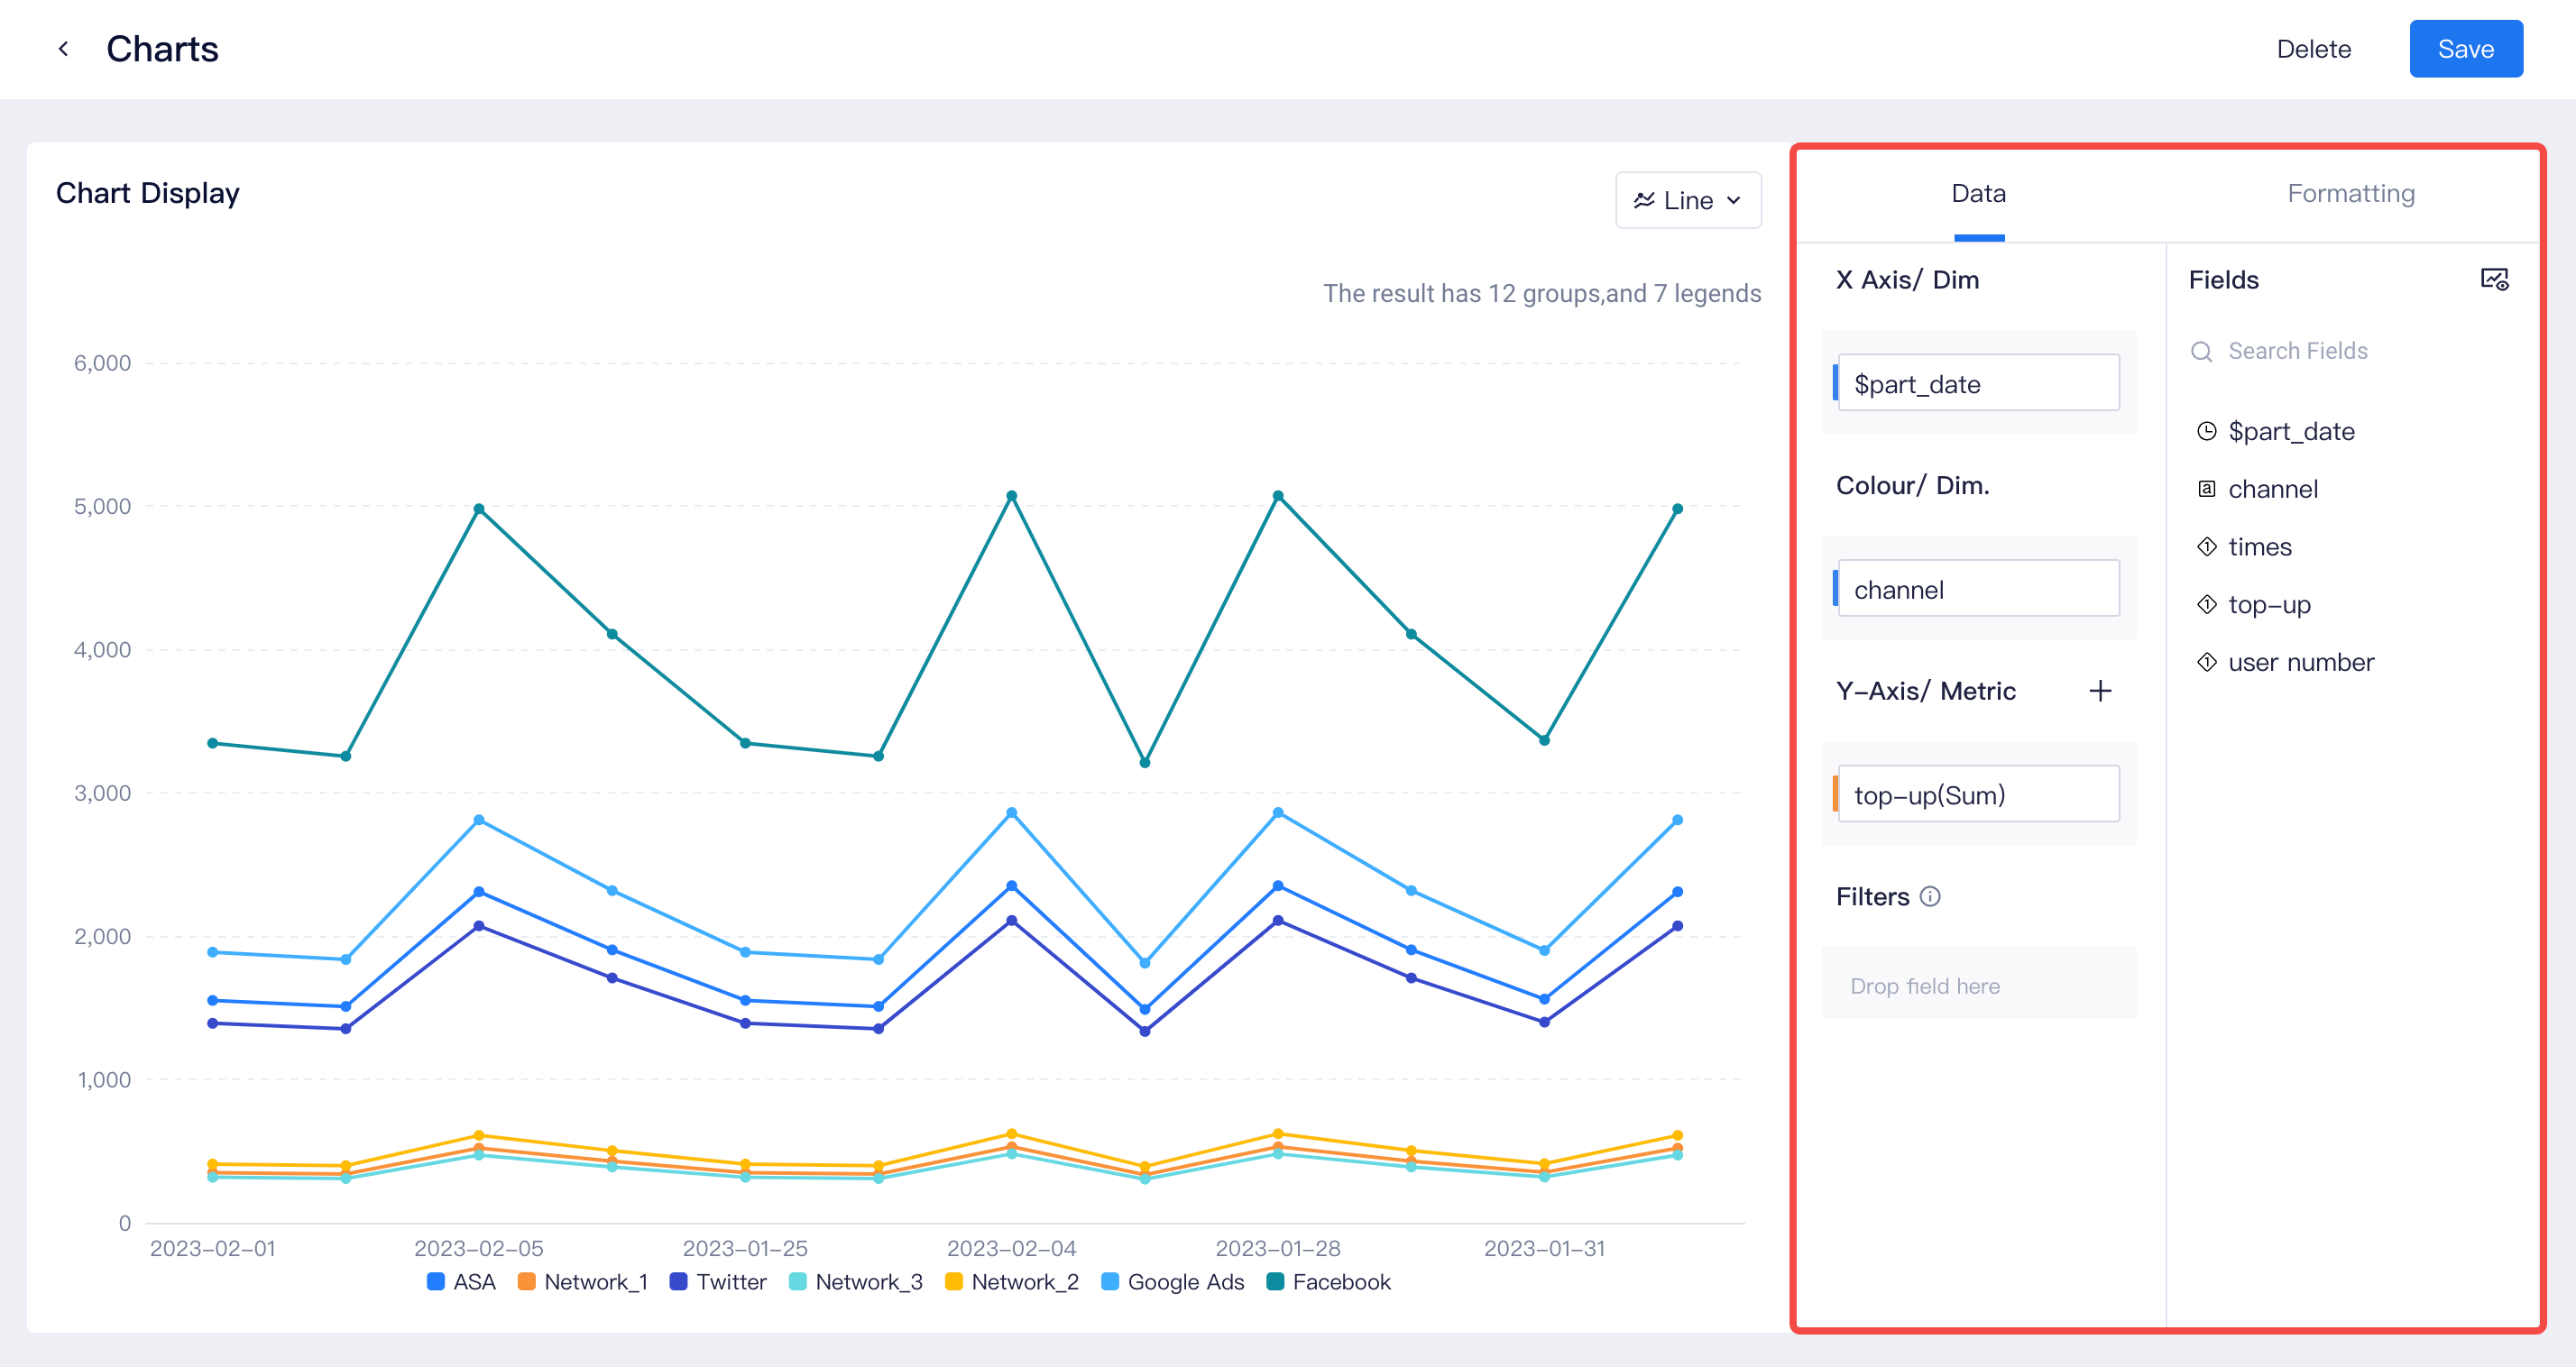
Different configuration items correspond to different mapping logics. Take the line and scatter plots, for instance. The mapping logic for the fields are as follows:
| Chart Type | Configuration item | Mapping description |
|---|---|---|
| Line chart | X-Axis/ Dim. | Mapped to x-axis |
| Colour/ Dim. | Mapped to colour legend | |
| Y-Axis/ Metric | Mapped to metric value | |
| Scatter diagram | X-Axis | Mapped to coordinate points on x-axis, taking numerical value |
| Y-Axis | Mapped to coordinate points on x-axis, taking numerical value | |
| Groups | Mapped to point information | |
| Colour | Mapped to point color | |
| Size | Mapped to point size |
You may select an aggregation type for metric field depending on specific scenario. The aggregation modes for different field types are as follows:
| Field type | Aggregation mode |
|---|---|
| Number | sum, average, count, count distinct, maximum, minimum |
| Date/String/Boolean | count, count distinct |
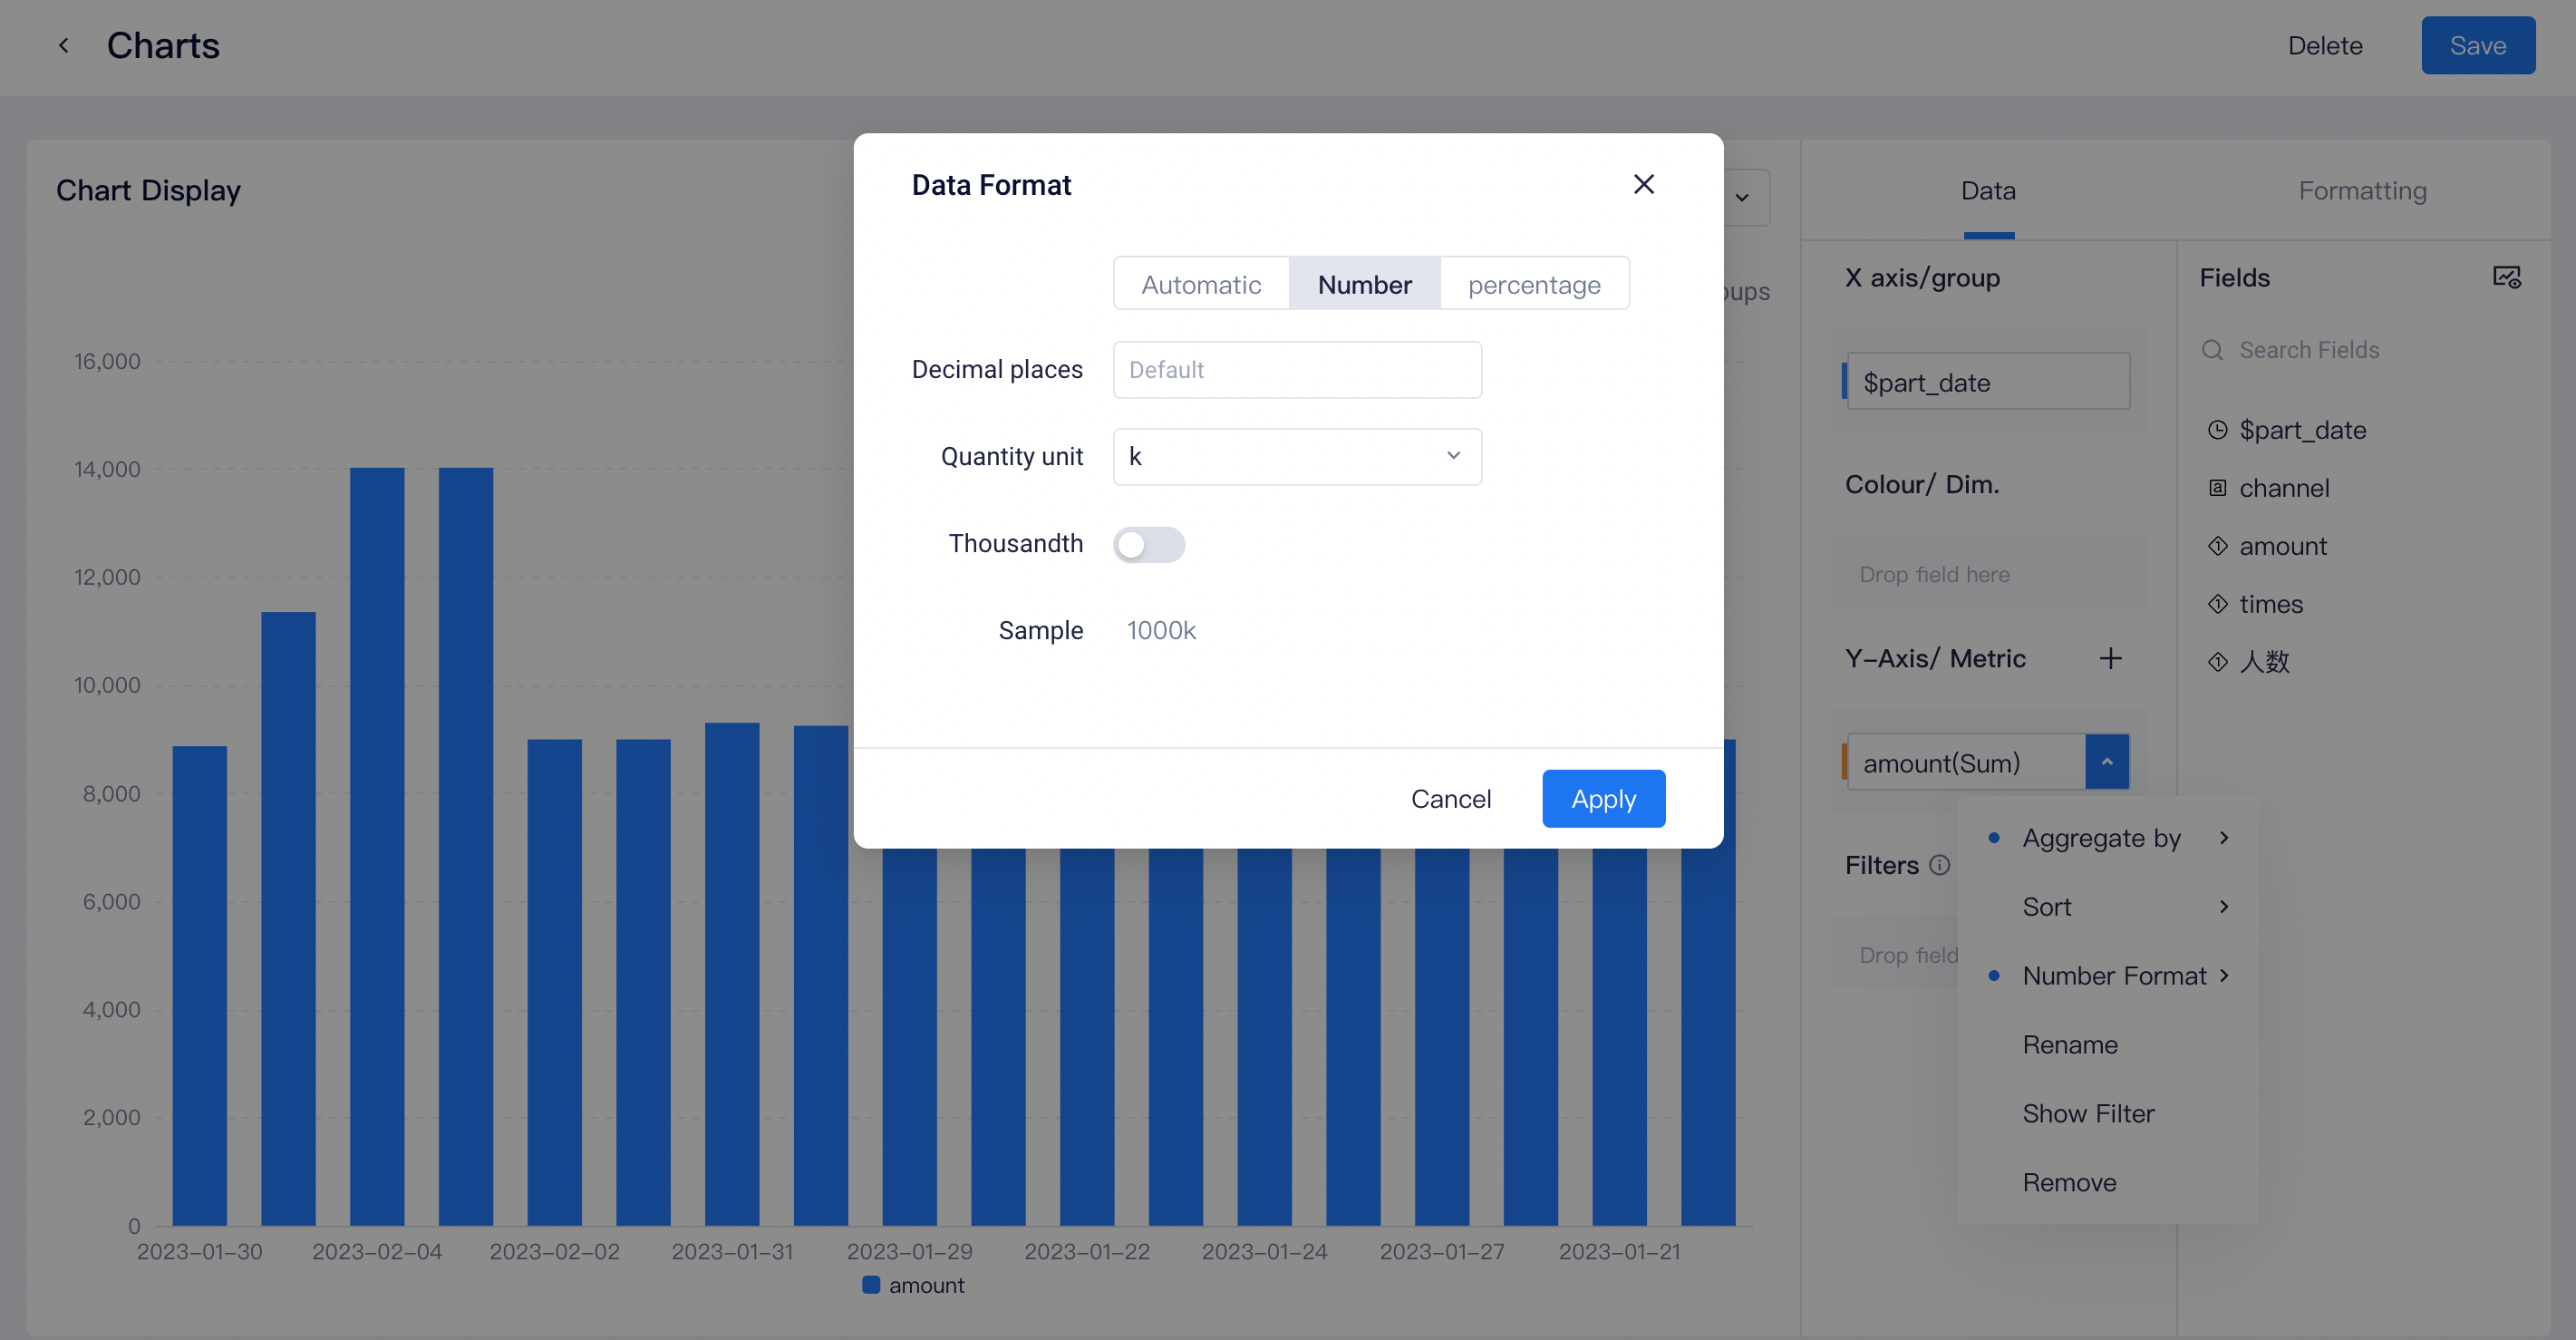
In addition, you may also set the display format for the data of a metric field:
- By default, data is shown with a thousandth with two decimals.
- You may customize decimal places, quantity units and whether to enable thousandth (a maximum of 10 decimal places are allowed, and trailing zeros to the right of the decimal point are not displayed).
# Chart formatting
You may modify the display detail of charts from the "Formatting" tab. Different type configurations are supported for different charts.

The configuration items for line charts, for example, are as follows:
- Display Setting: Configure how many first entries of data are displayed in x-axis and colour legends fields of the current chart.
- Axis: Configure whether to display axis tags and the display mode of axis tags.
- Metrics: Configure whether to display labels, as well as maximum and minimum values, on a chart.
- Groups: Configure whether to show the day of the week in the date field.
# Visualization analysis
# Sort by field
The sort-by-field feature supports sort by dimension field and by metric field.
- Modes supported by sort-by-dim
- Unsort
- Ascending order
- Descending order
- Sort by metric value
- For example, in the following descending order of channel fields by the total sum of top-up, the channel having the most top-up amounts will be displayed in a prioritized manner.

- For example, in the following descending order of channel fields by the total sum of top-up, the channel having the most top-up amounts will be displayed in a prioritized manner.
Sort by metrics
- Sort by table metrics
- Ascending order, descending order and unorder can be set for specified metric.

- Ascending order, descending order and unorder can be set for specified metric.
- Sort by table metrics
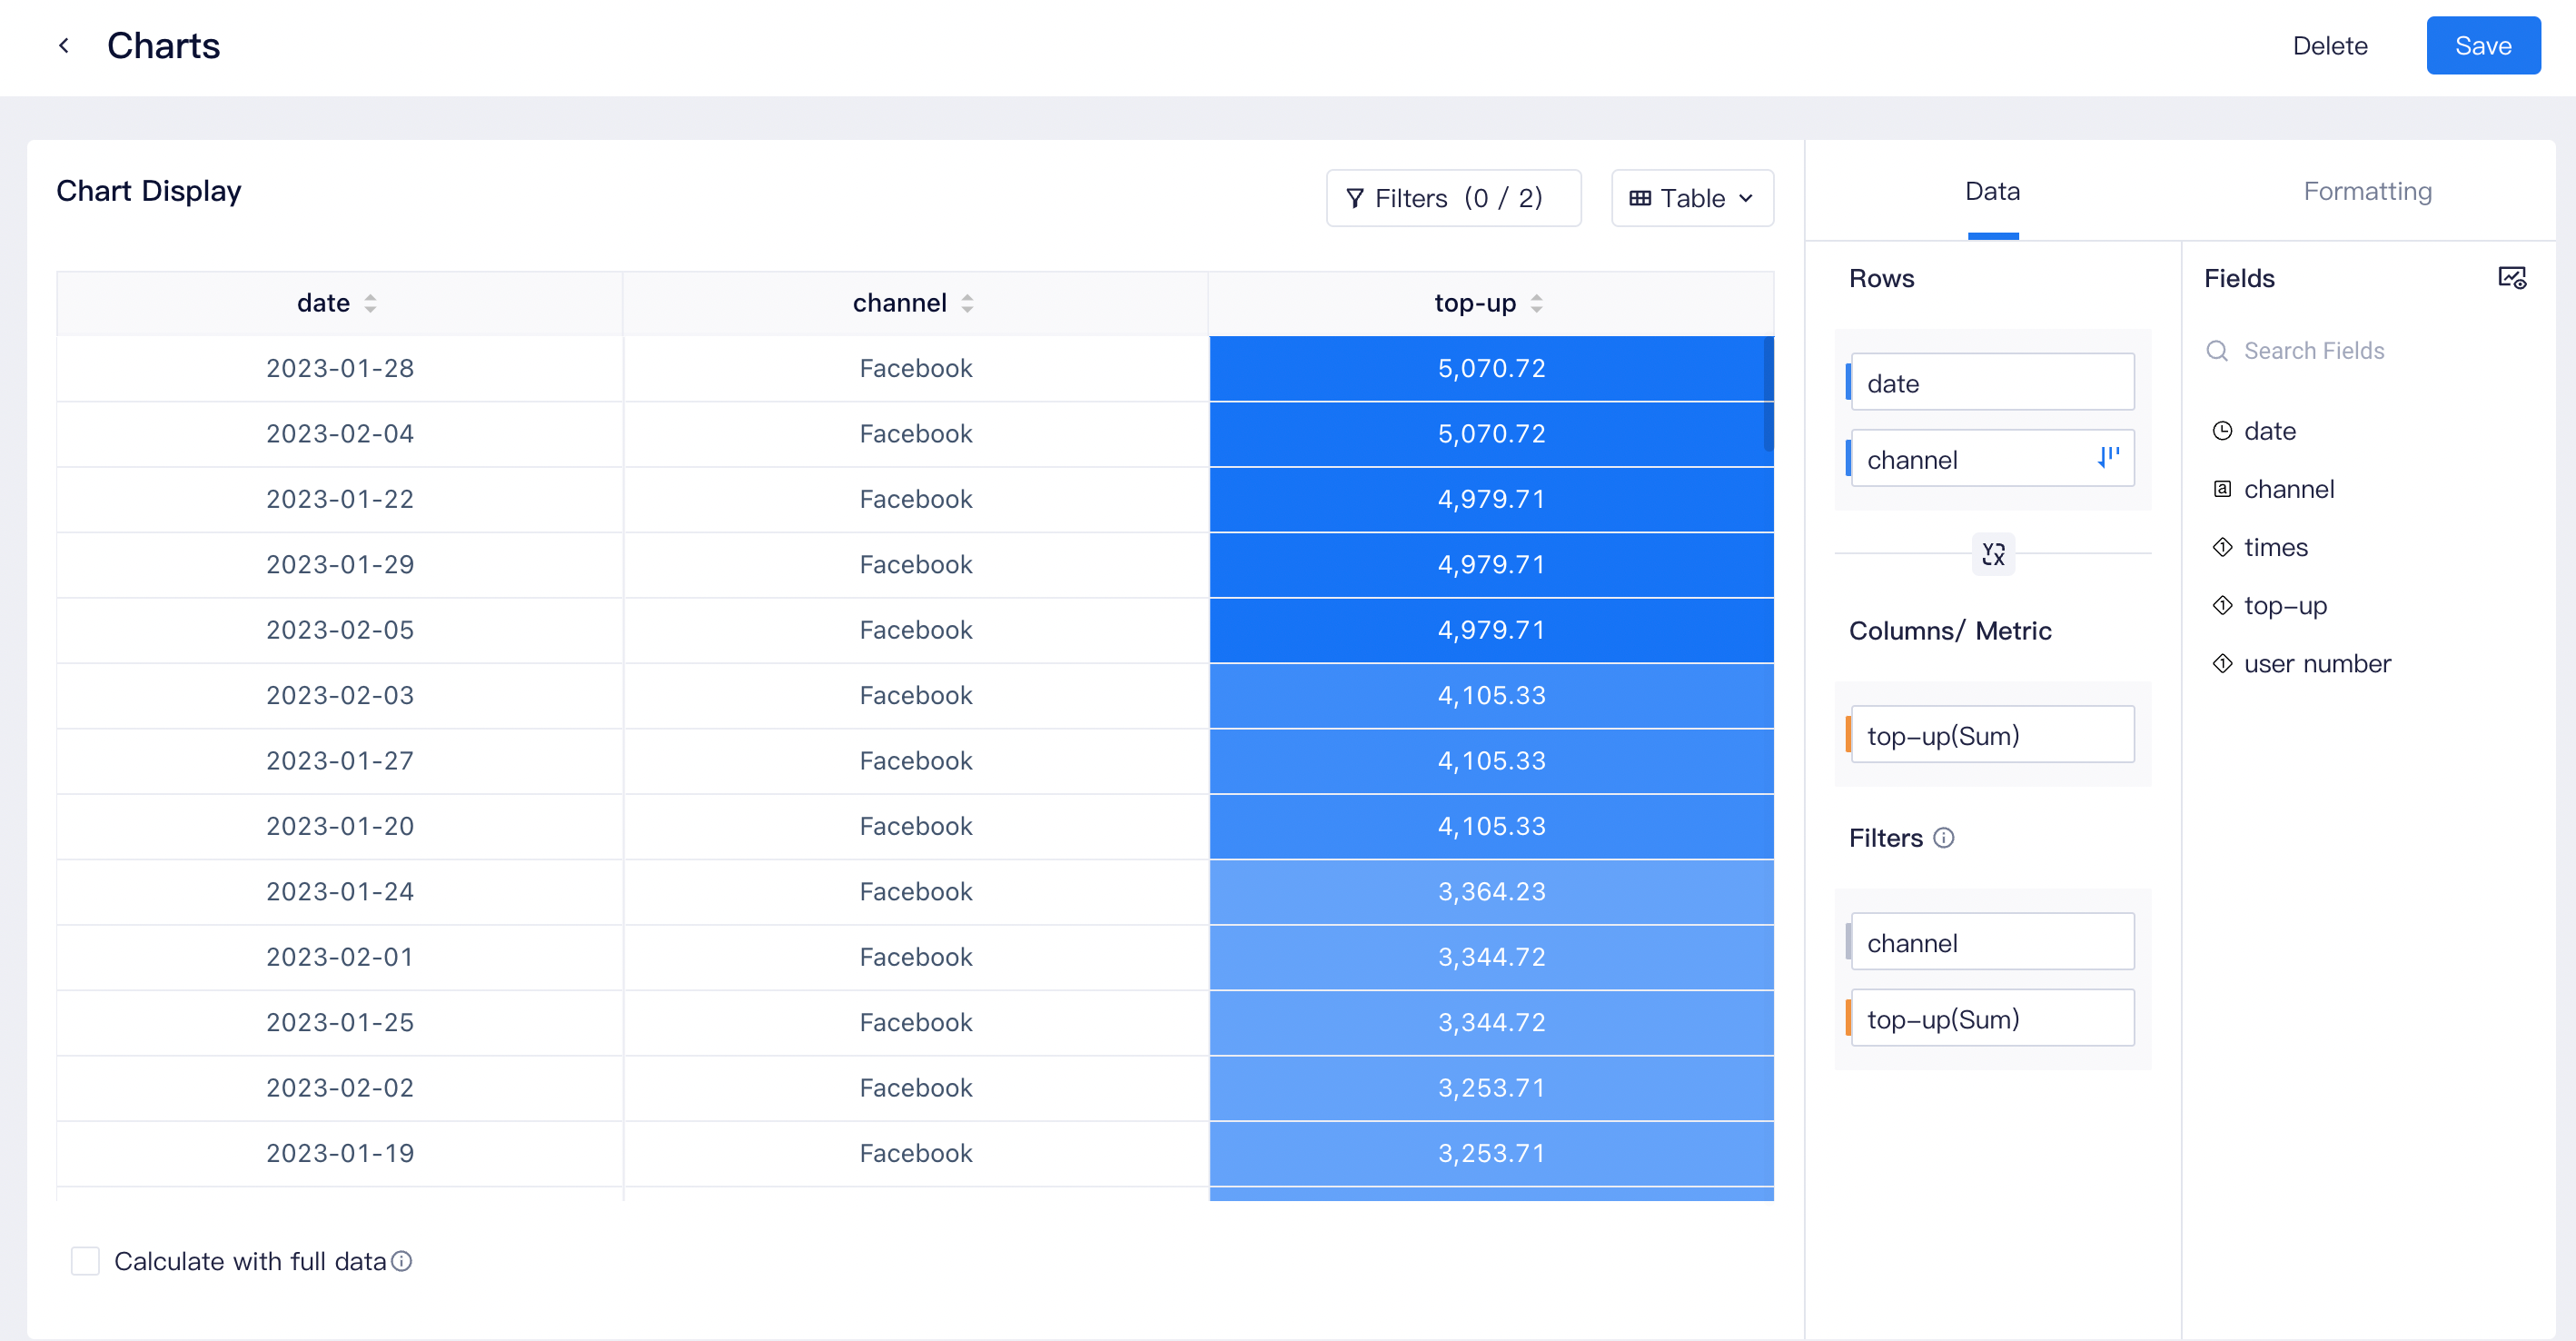
Metric order for line/ bar / stacked bar charts.
- Logic of order: Order X-axis/dim fields by metric values, and when there exists colour/ dim fields, order these fields by their metric values.
- Case: As shown in the following figure, the total top-up is sort in a descending order:
- "date" is sorted in a descending order by total top-up
- "channel" is sorted in a descending order by total top-up

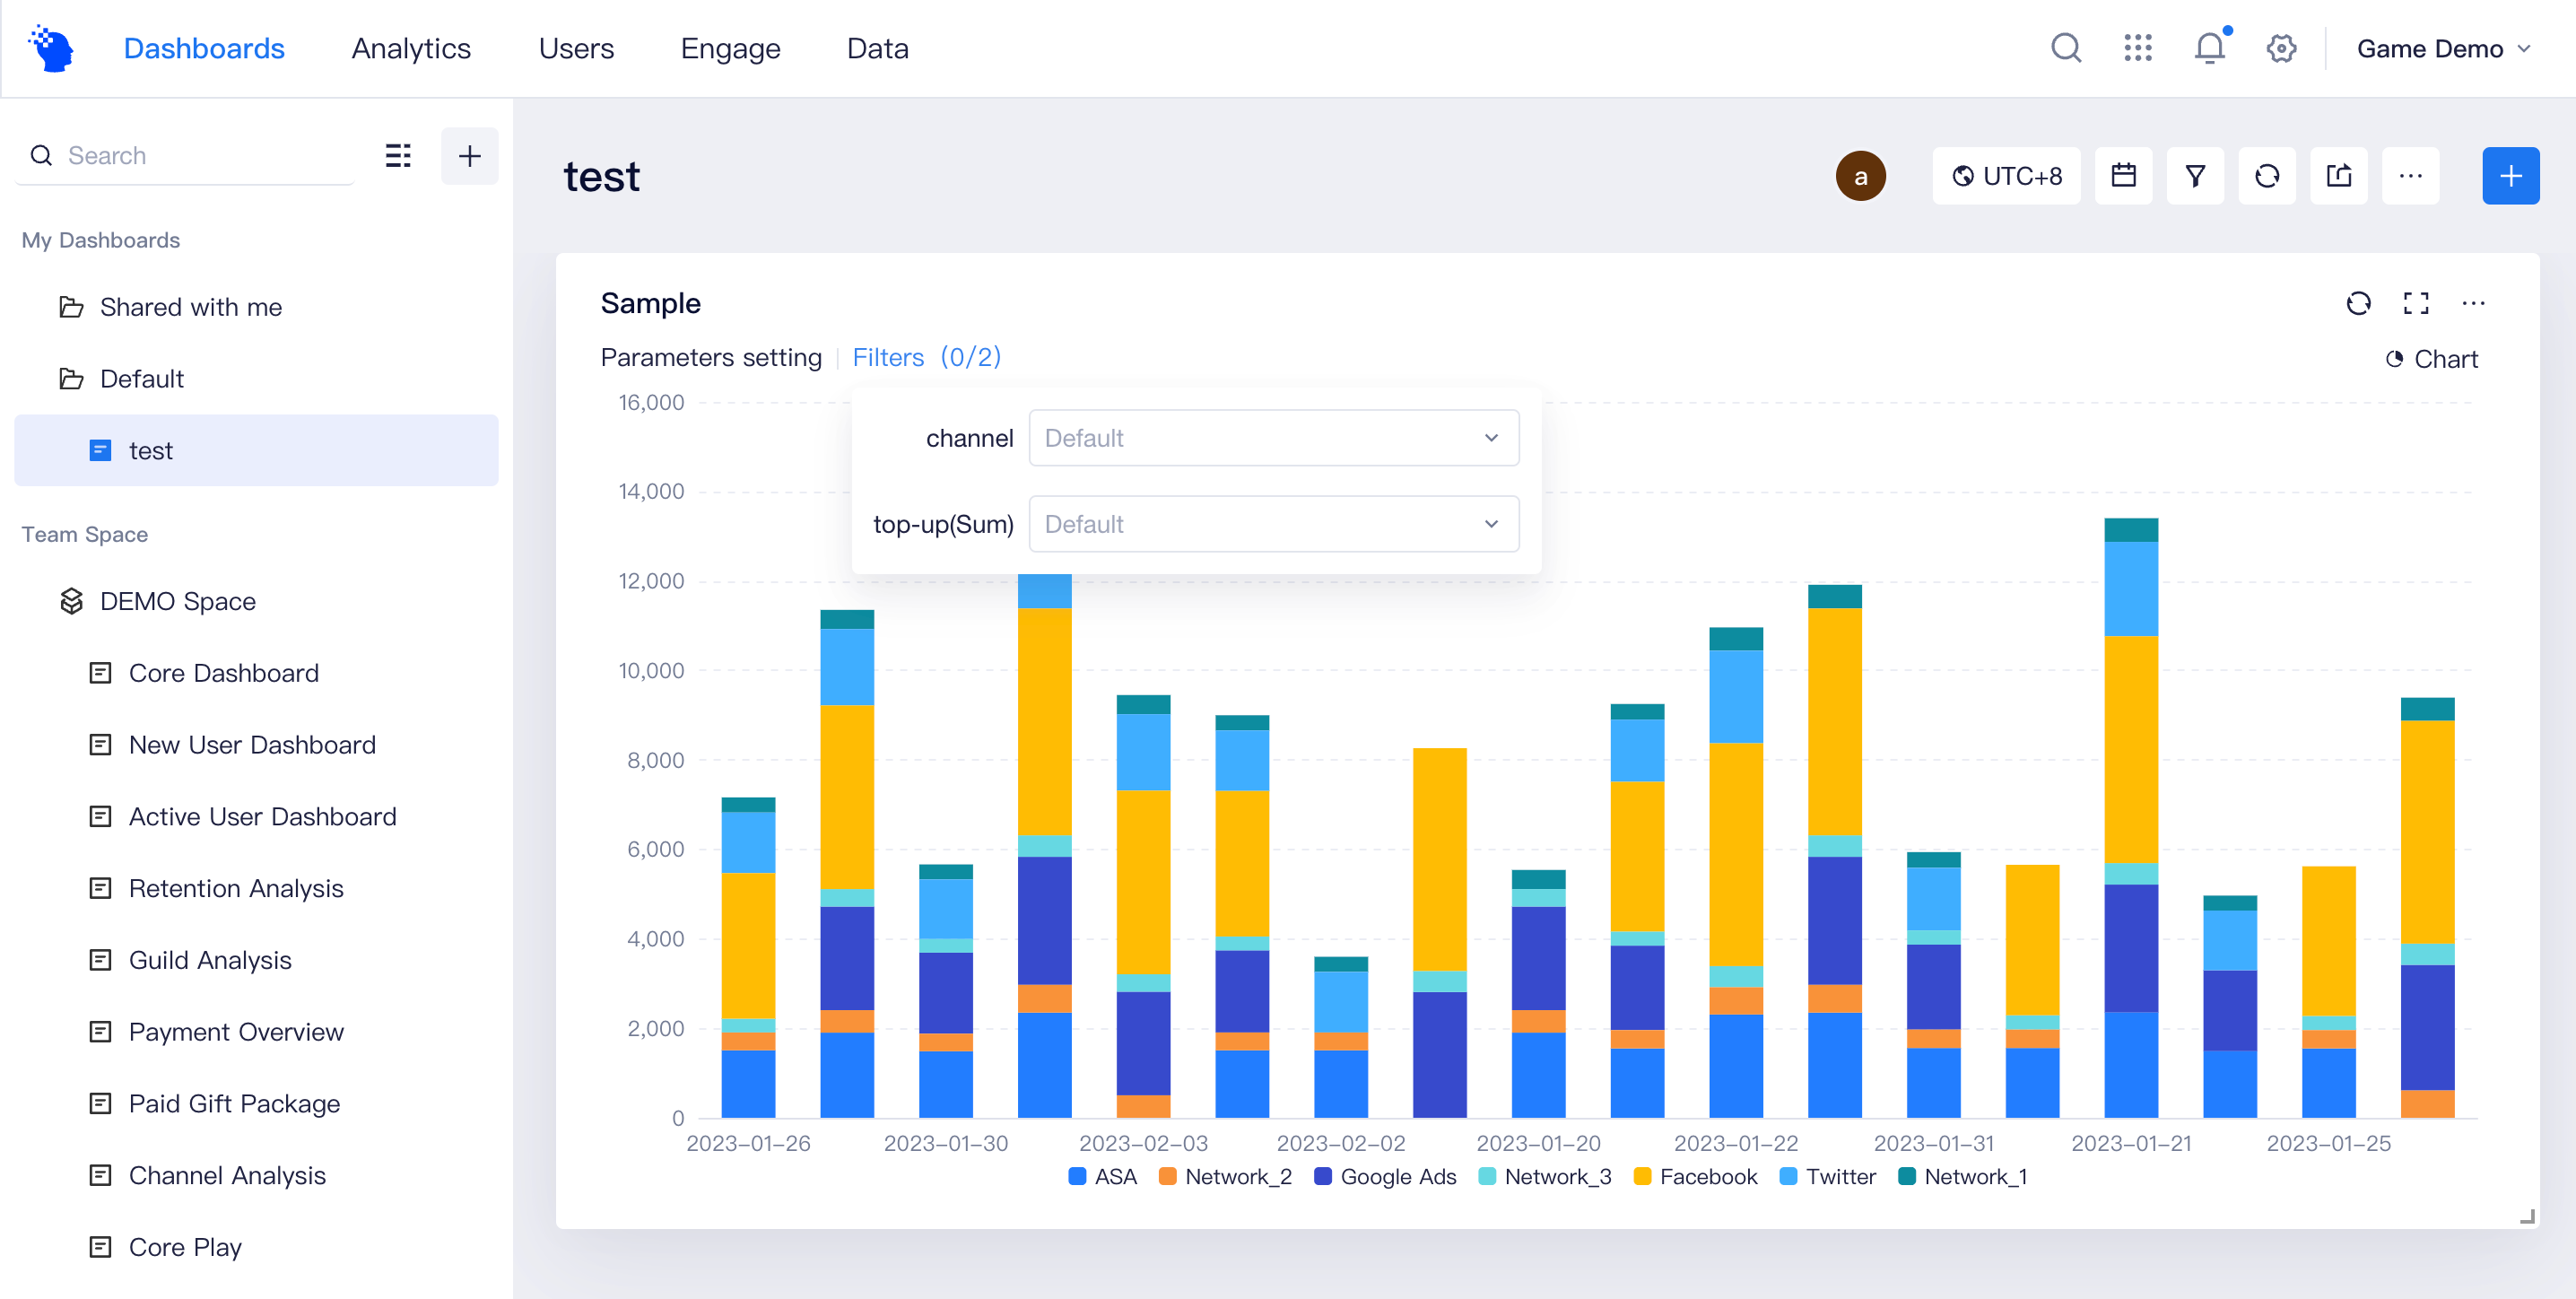
# Filters
The In-chart filter performs filtering operations in order to display data that users want to focus on. You can drag and drop any field from the query results to the in-chart filter; or click the drop down arrow on the right side of the metric to add the metric into the filter.
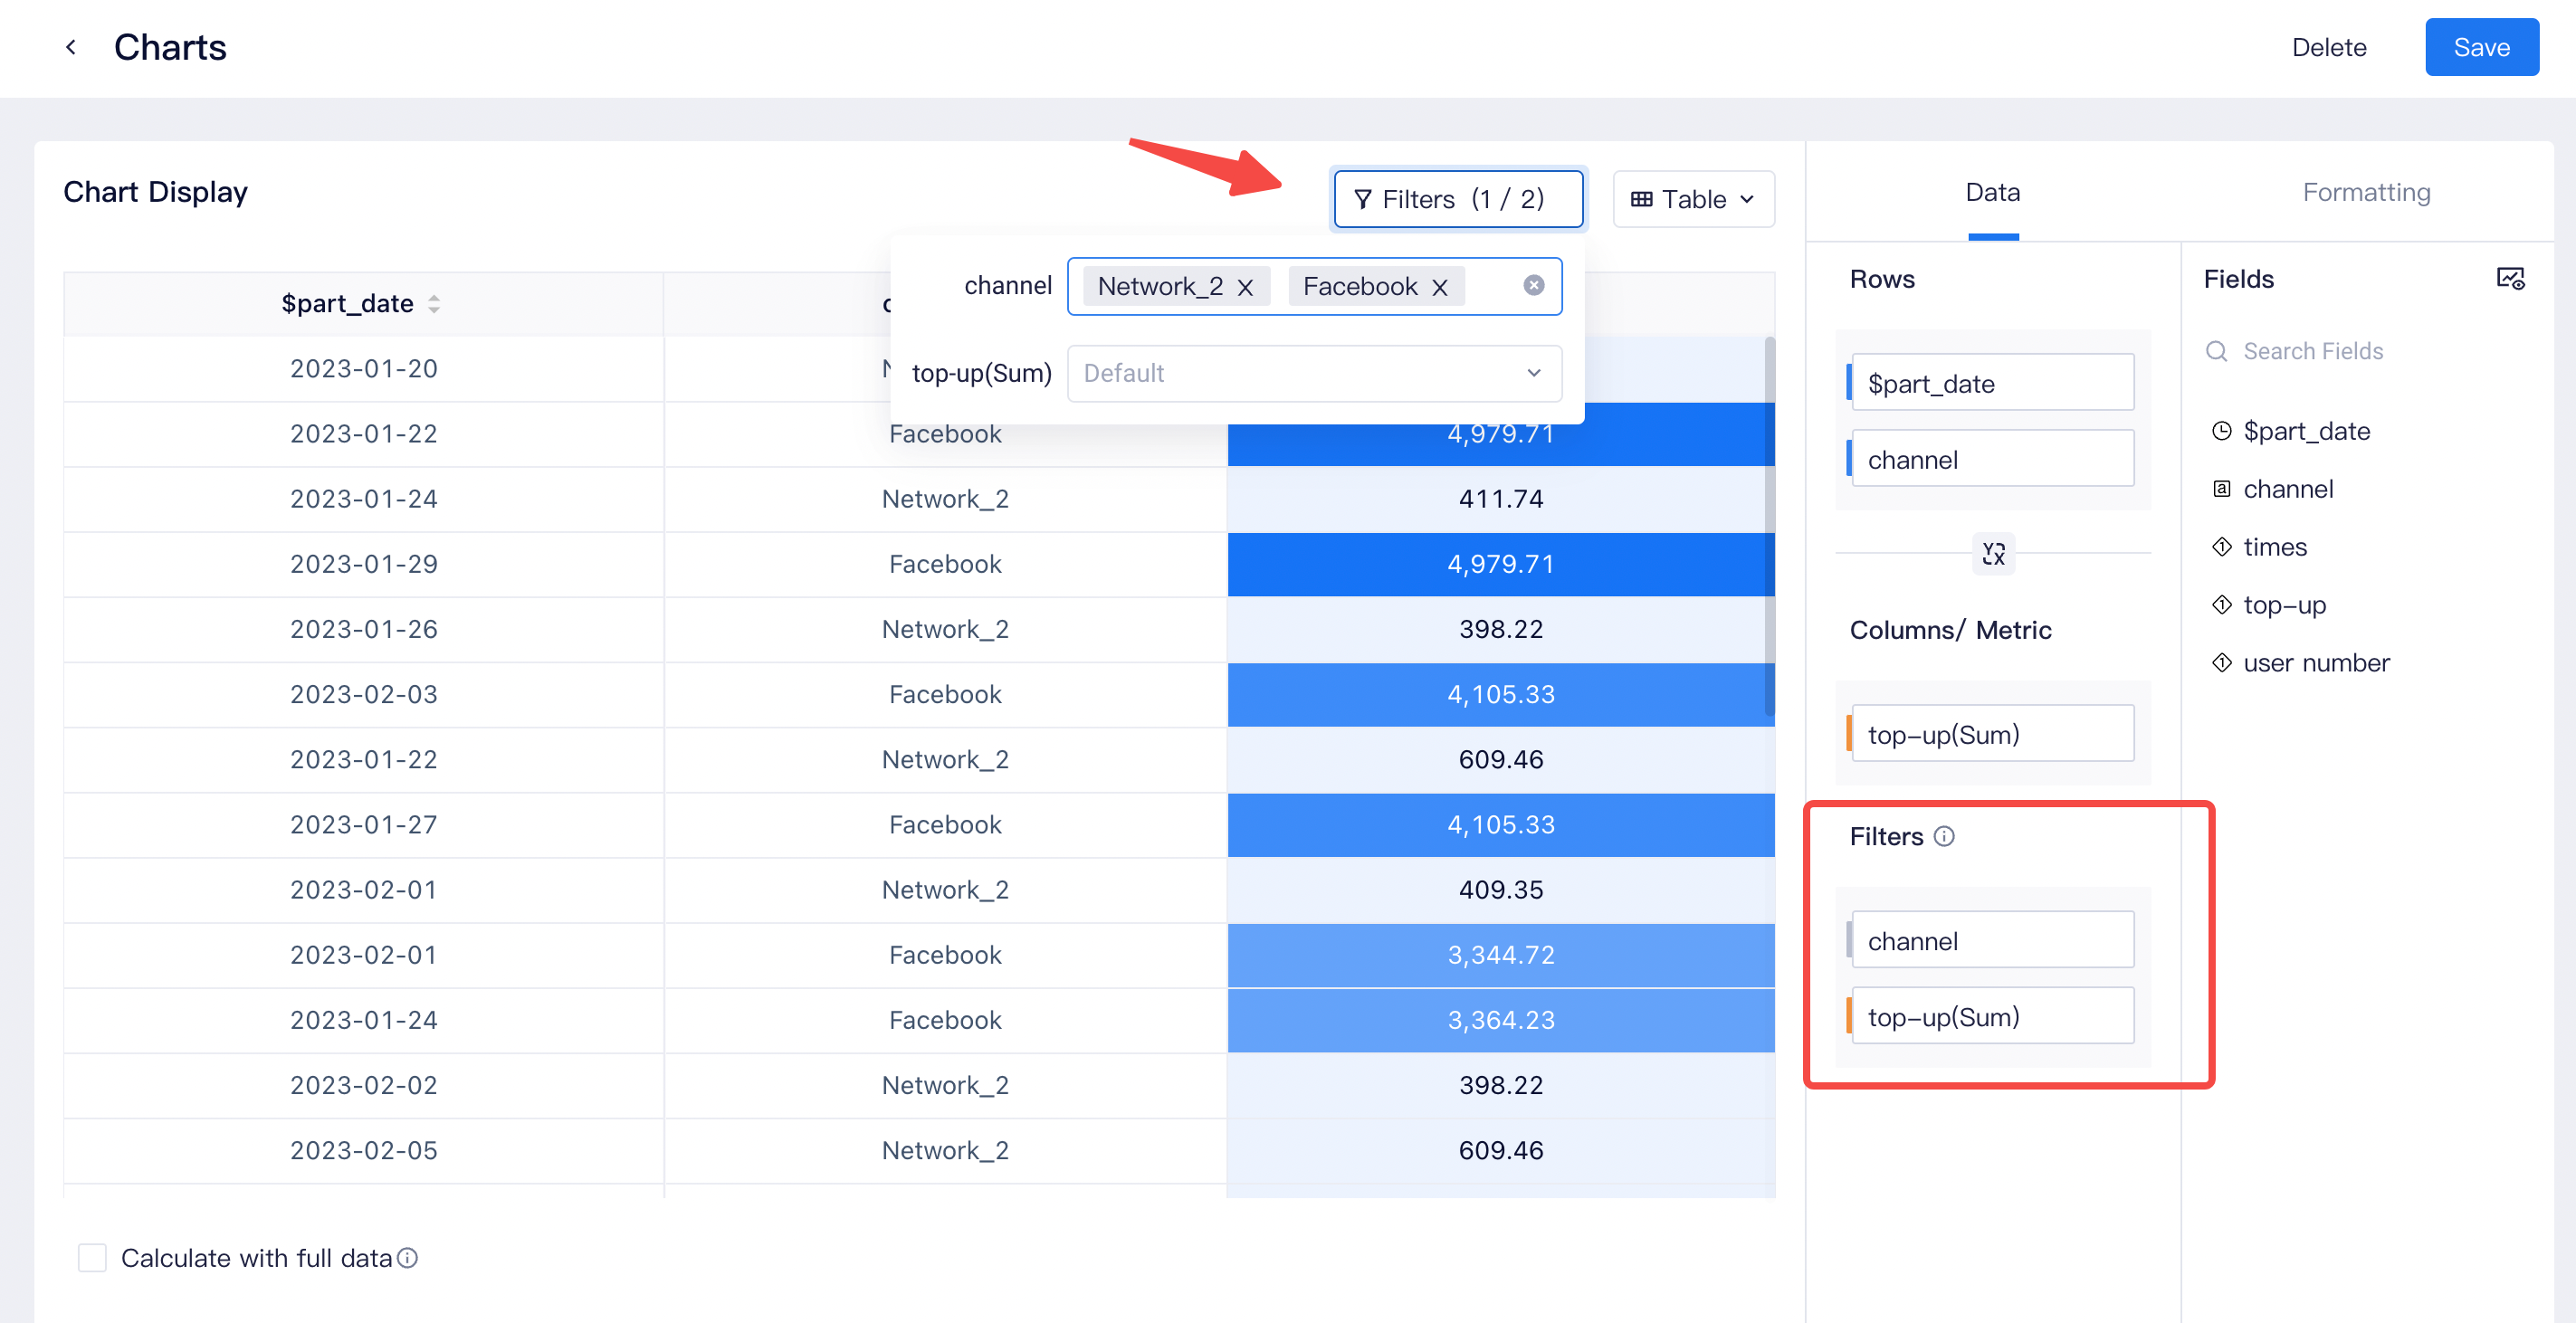
Add in-chart filter and save the report, and after putting it into the dashboard, you will be able to perform filtering operation when viewing the dashboard.
# Computational logic
# Compute using full data
On the configuration page, when SQL query results exceed the upper limit of returns (20,000 entries by default), only computational results of returned data across visualization configurations will be displayed in order to avoid repeated loading of computation in the process of visualization configuration that leads to performance problems.
If you want to view computational results of all data on the visualization configuration page, you can click "Calculate with full data" on the lower left corner.

TIP
This item is provided mainly to address the performance experience problem arising from repeated loading and computation during visualization configuration. When viewing results on report page or dashboard, the results will be computed and displayed based on full data.
In addition, if the number of query results of the model exceeds the upper limit, re-computation based on full data will also be initiated when sorting or filtering operation is performed on the report page or dashboard in order to ensure the validity of results.