# Funnel
Funnel analysis is generally used to observe the conversion and churn performances across different steps of a process. From a business perspective, you may configure events successively triggered by users as funnel steps and identify the direction of optimization by viewing the conversion rates between different steps.
In Funnel analysis, you will be able to find answers to the following questions:
- With a decrease of new users of the day occurs, is there any exception in the process from download to registration?
- Which one of the new user processes entails a high churn rate that needs to be optimized?
- How is the progress of episode clearing across different regional servers?
# Definition of completing funnel conversion
Before configuring funnel steps, you should first understand the definition of completing funnel conversion.
First, you need to select Entities. The model will start with entities you have selected to compute whether the same entity can successively complete different funnel steps, no matter what events are triggered in the middle.
For example, if the funnel steps you configured are as follows: A -> B -> C -> D:
- The sequence of A -> B -> C -> D will be considered as completing the entire funnel conversion.
- The sequence of A -> B -> E -> C -> D will also be considered as completing the entire funnel conversion.
- The sequence of A -> B -> D will be considered churned at step 3 because event C has not been completed and thus step D is also ruled out of the funnel.
If a user has multiple sequences satisfying funnel steps within the selected time period, then the sequence involving the most steps will be taken into computation; if all these steps have completed funnel conversion or involve the same missing step, then the earliest sequence in chronological order will be taken.
# Quick configuration of funnel steps
When analyzing the conversion process of new users, actions that are successively triggered like installation, registration, login and beginner guidance can be set as funnel steps. If there are multiple optional events in a step in actual business, triggering any one of the events can be regarded as completing the step, you can merge two or more events into a single event through Custom Event.
By default, the model supports adding a maximum of 30 funnel steps. You can contact the Customer Success Manager to adjust the upper limit.

After configuring funnel steps, you need to set an analysis window ranging from 180 days to 1 minute. Starting from the time when step 1 is triggered by the user, the model counts and analyzes whether there are events completing the subsequent funnel steps in a successive manner.
To create a more accurate conversion funnel, you can also "Hold Properties Constant". In this case, users are not only required to complete stepwise events, but the property values of these events should be exactly the same. Events with a null property value will not be computed.
For example, if you want to perform statistics on users' Product Exposure-Click-Buy funnel, you can designate product ID as the associate property to ensure the aforementioned actions take place on the same product.
You may also conduct Data Filtering and Group by process. It should be noted that if you group users by event properties or dynamic matching of tags, then the group by paradigm used in step 1 of the "sequence used in computation" will be used as the group-by basis in the whole sequence.
# View the overall conversion or trend
Funnel analysis supports viewing conversion and churn from two different perspectives depending on analysis requirements.
- Conversion
If you want to view the overall conversion and churn within a period of time, you may select conversion plot where each column denotes the number of entities triggering different funnel steps under a corresponding group.
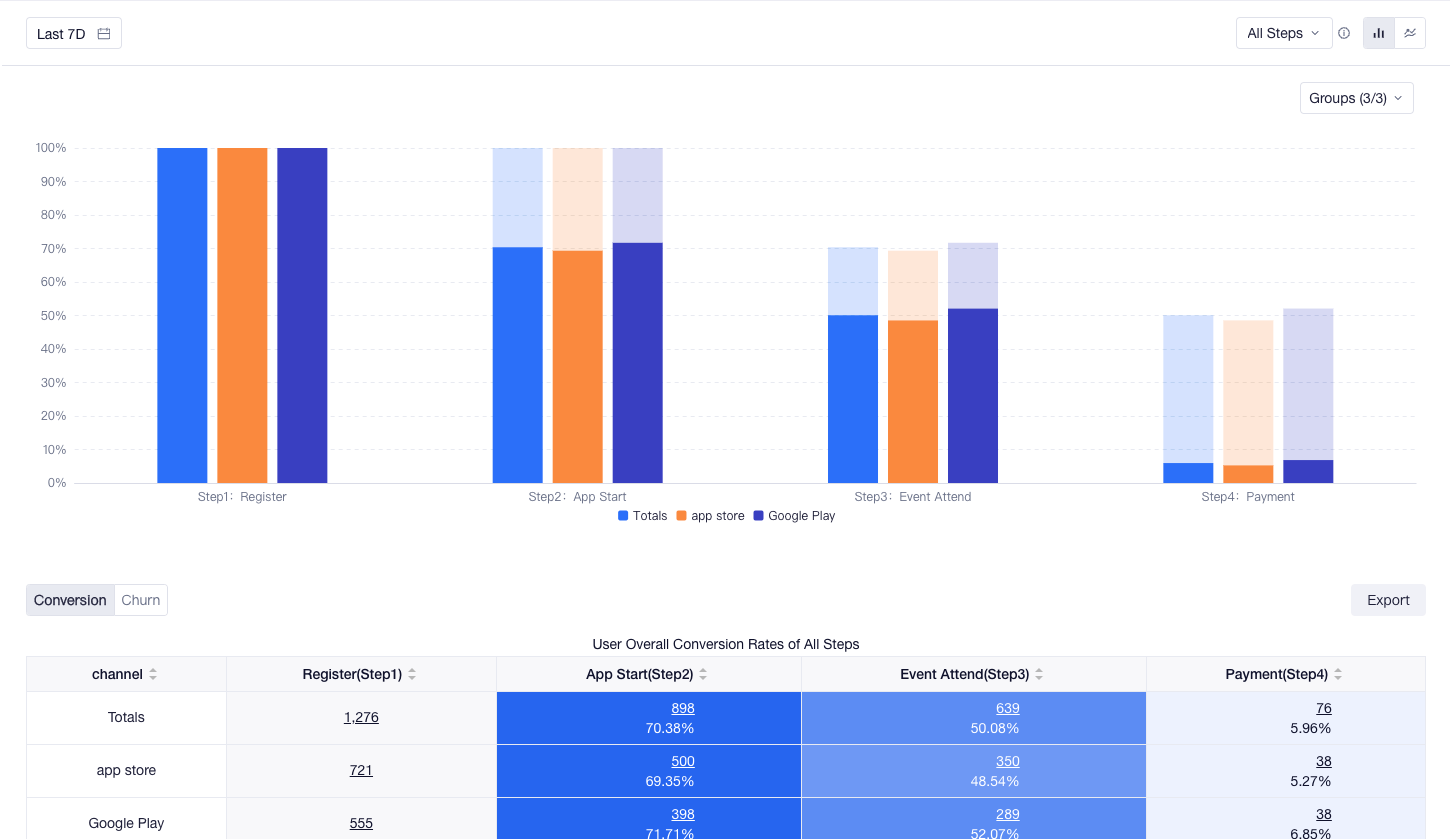
To facilitate you to compare the data performance of different groups on the plot, a conversion plot displays a maximum of 4 group values. You may select group values based on your business scenarios or view detailed data of all group values in the conversion table.
- Line
If you want to view daily conversion and churn within a period of time, you may select the line plot where each line represents the trend of conversion rate on a daily basis under each group value.
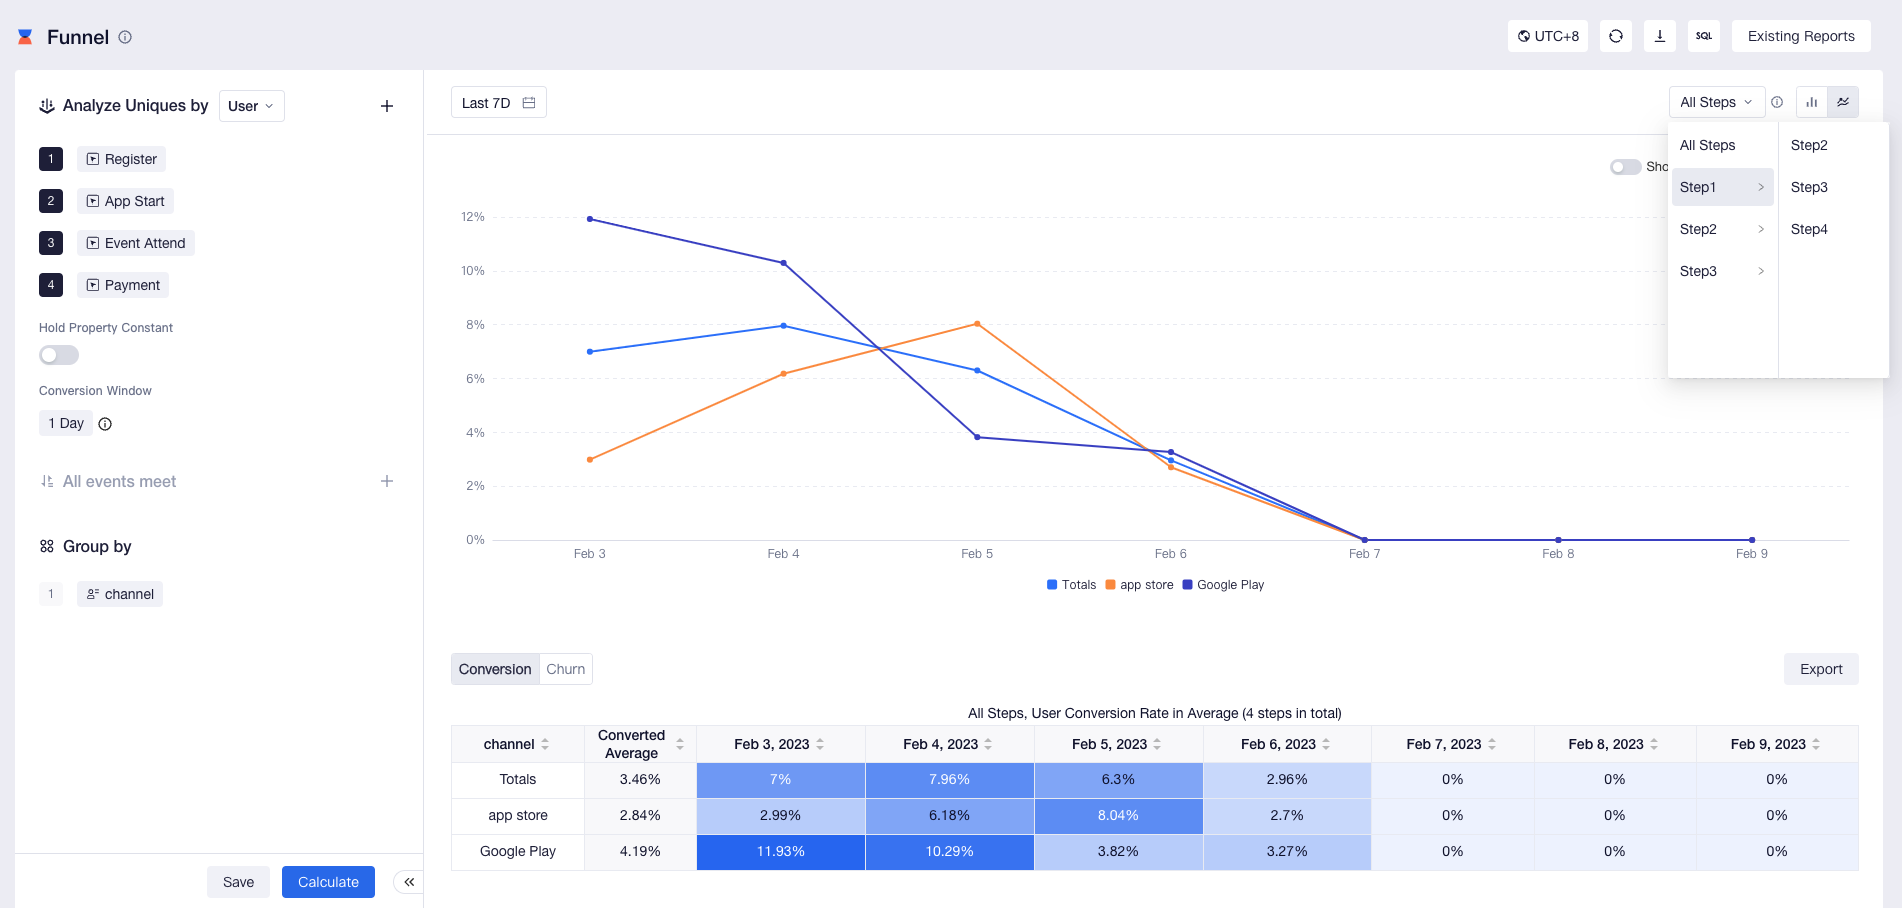
By default, the line plot displays the conversion rate of all steps (step 1 -> the last step, and the entity should have experienced the whole sequence). You may also switch to analyzing the conversion rate changes between any step to more accurately identify problems.