# Debugging and Logging
During the process of SDK integration, you can perform real-time debugging by checking SDK's logs in the IDE console or using the Debug feature of TE.
# Printing Log
You can set showLog to true when the SDK is initialized,after opening the log,you can check SDK's logs on the browser console.
var config = {
    appId: "xxx",
    serverUrl: "xxx",
    showLog:true
};
# 2. Debugging
You need to follow the following two steps to enable the Debug mode:
- Enable the debug mode at the client
The sample code for enabling the Debug Mode on the client is as follows:
var config = {
    appId: "xxx",
    serverUrl: "xxx",
    /*
    NORMAL mode: the data would be saved in caches and reported according to relevant cache policies under the NORMAL mode by default. It is recommended to use the mode in an online environment
    Debug mode: report data item by item. If problems occur, the user would be notified with logs and anomalies. It is recommended to use the Debug mode in an online environment
    DebugOnly mode: data would be verified without being stored; it is not recommended to use the DebugOnly mode in an online environment
     */
    mode:"debug"
};
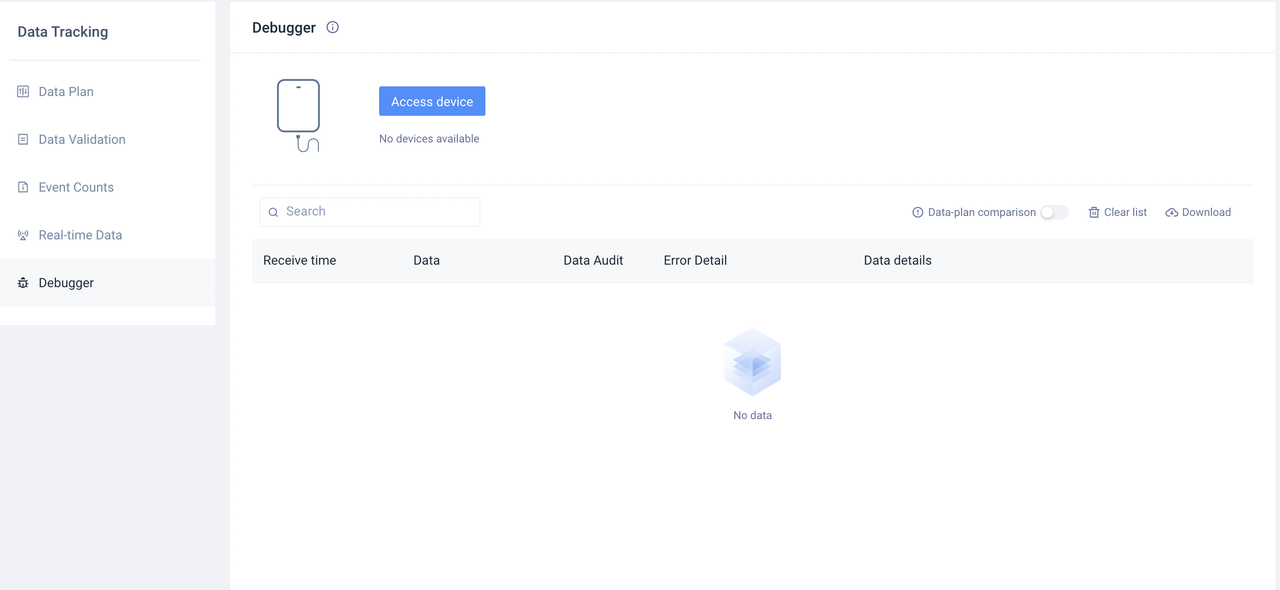
- Add Device
To avoid launching the Debug mode in the production environment, it is required that only specified device can enable Debug Mode. The Debug Mode can only be enabled for devices whose IDs have been configured in the "Debugger"sector on the "Tracking Management" page of TE when the client side has enabled the Debug mode.
Device ID could be obtained by the following three means:
- #device_id:property in the event data of TE
- Client-side log: DeviceID would be printed as log after SDK is initialized
- Call API:Device ID
The Debug Mode may undermine the data tracking quality and stability of the Application. It could only be used for data verification at the integration stage, and should not be used in the production environment.