# デバッキング
SDKでデータアクセスを実装する中で、IDEコントローラー中のログまたはTEのDebug機能を利用してでバッキングできます。
# SDKログをプリント
SDK初期設定でshowLogをtrueに設定し、SDKログをプリントできます。
var config = {
    appId: "xxx",
    serverUrl: "xxx",
    showLog:true
};
# Debugモードを起動
Debugモードは以下の2ステップで操作可能です
- クライアントでDebugモードを起動
以下はクライアントでDebugモードを起動するコード例:
var config = {
    appId: "xxx",
    serverUrl: "xxx",
    /*
    NORMAL mode: the data would be saved in caches and reported according to relevant cache policies under the NORMAL mode by default. It is recommended to use the mode in an online environment
    Debug mode: report data item by item. If problems occur, the user would be notified with logs and anomalies. It is recommended to use the Debug mode in an online environment
    DebugOnly mode: data would be verified without being stored; it is not recommended to use the DebugOnly mode in an online environment
     */
    mode:"debug"
};
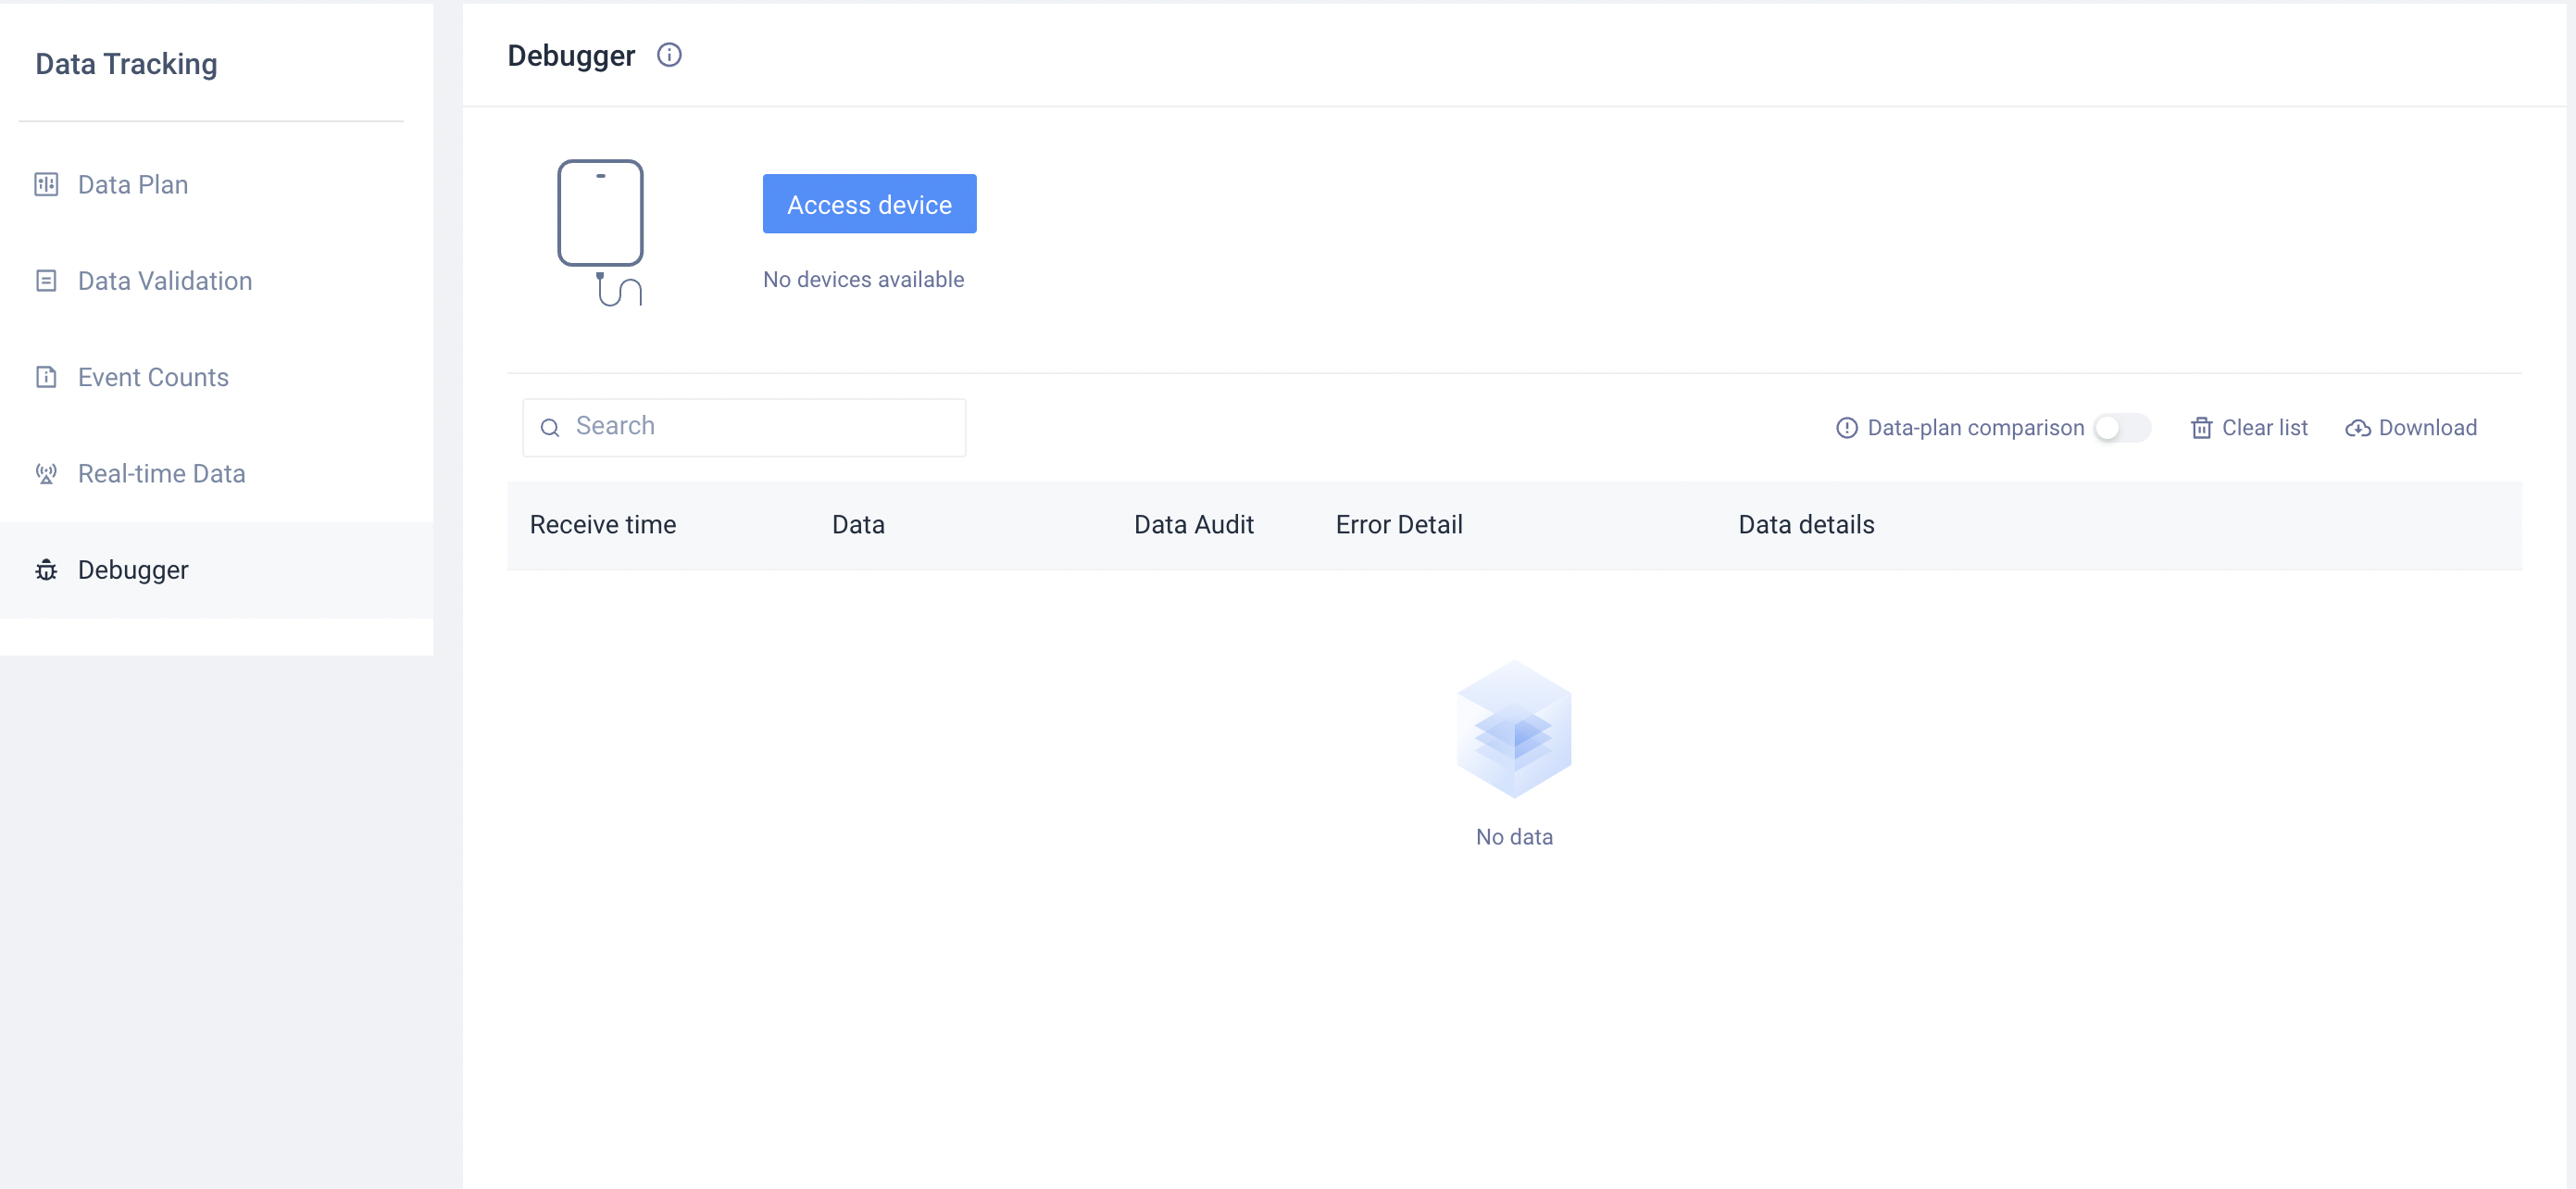
- TEシステム内でDebugデバイスを追加
Debugモードを本番環境でリリースしてしまうことを避けるため、特定のデバイスのみDebugモードが起動できます。
クライアントでDebugモードを起動し、デバイスIDをTEシステムの「データ管理」→「デバッグモード」で追加した上でDebugモードに起動できます。
デバイスIDは以下の3種の方法で取得可能です。
- TEシステムのイベントデータの#device_id
- クライアントログ:SDK初期化完了後にプリントしたDeviceId
- 呼び出しで取得:デバイスID取得
Debugモードはデータ収集の質とAppの安定性に影響しますため、データ検証のみお使いください。