# SQL IDE
Apart from using the analysis models explained above, you can also conduct advanced analyses that can not be fulfilled by analysis models using SQL statements and customize the query of the data of all projects under the current cluster. If you find anything valuable in SQL query, you can distill it as a report and display it like other model reports on Dashboard.
# Compile query statements in the editor
The TE system employs the Trino query engine and you can compile query statements through standard SQL. The following is a simple example:
SELECT
"$part_date"
, count(DISTINCT "#user_id")
FROM
ta.v_event_1
WHERE ("$part_date" BETWEEN '2023-01-01' AND '2023-01-07') AND ("$part_event" = 'login')
GROUP BY "$part_date"
ORDER BY "$part_date" ASC
The following should be noted during compilation:
- The field name should be enclosed with double quotation marks
" "or accept the default. However, if the field you are querying contains special characters (e.g.,$、#), then double quotation marks must be used. - Strings must be enclosed by single quotation marks
' '. - You can use
SELECTstatements andWITHsubstatements.
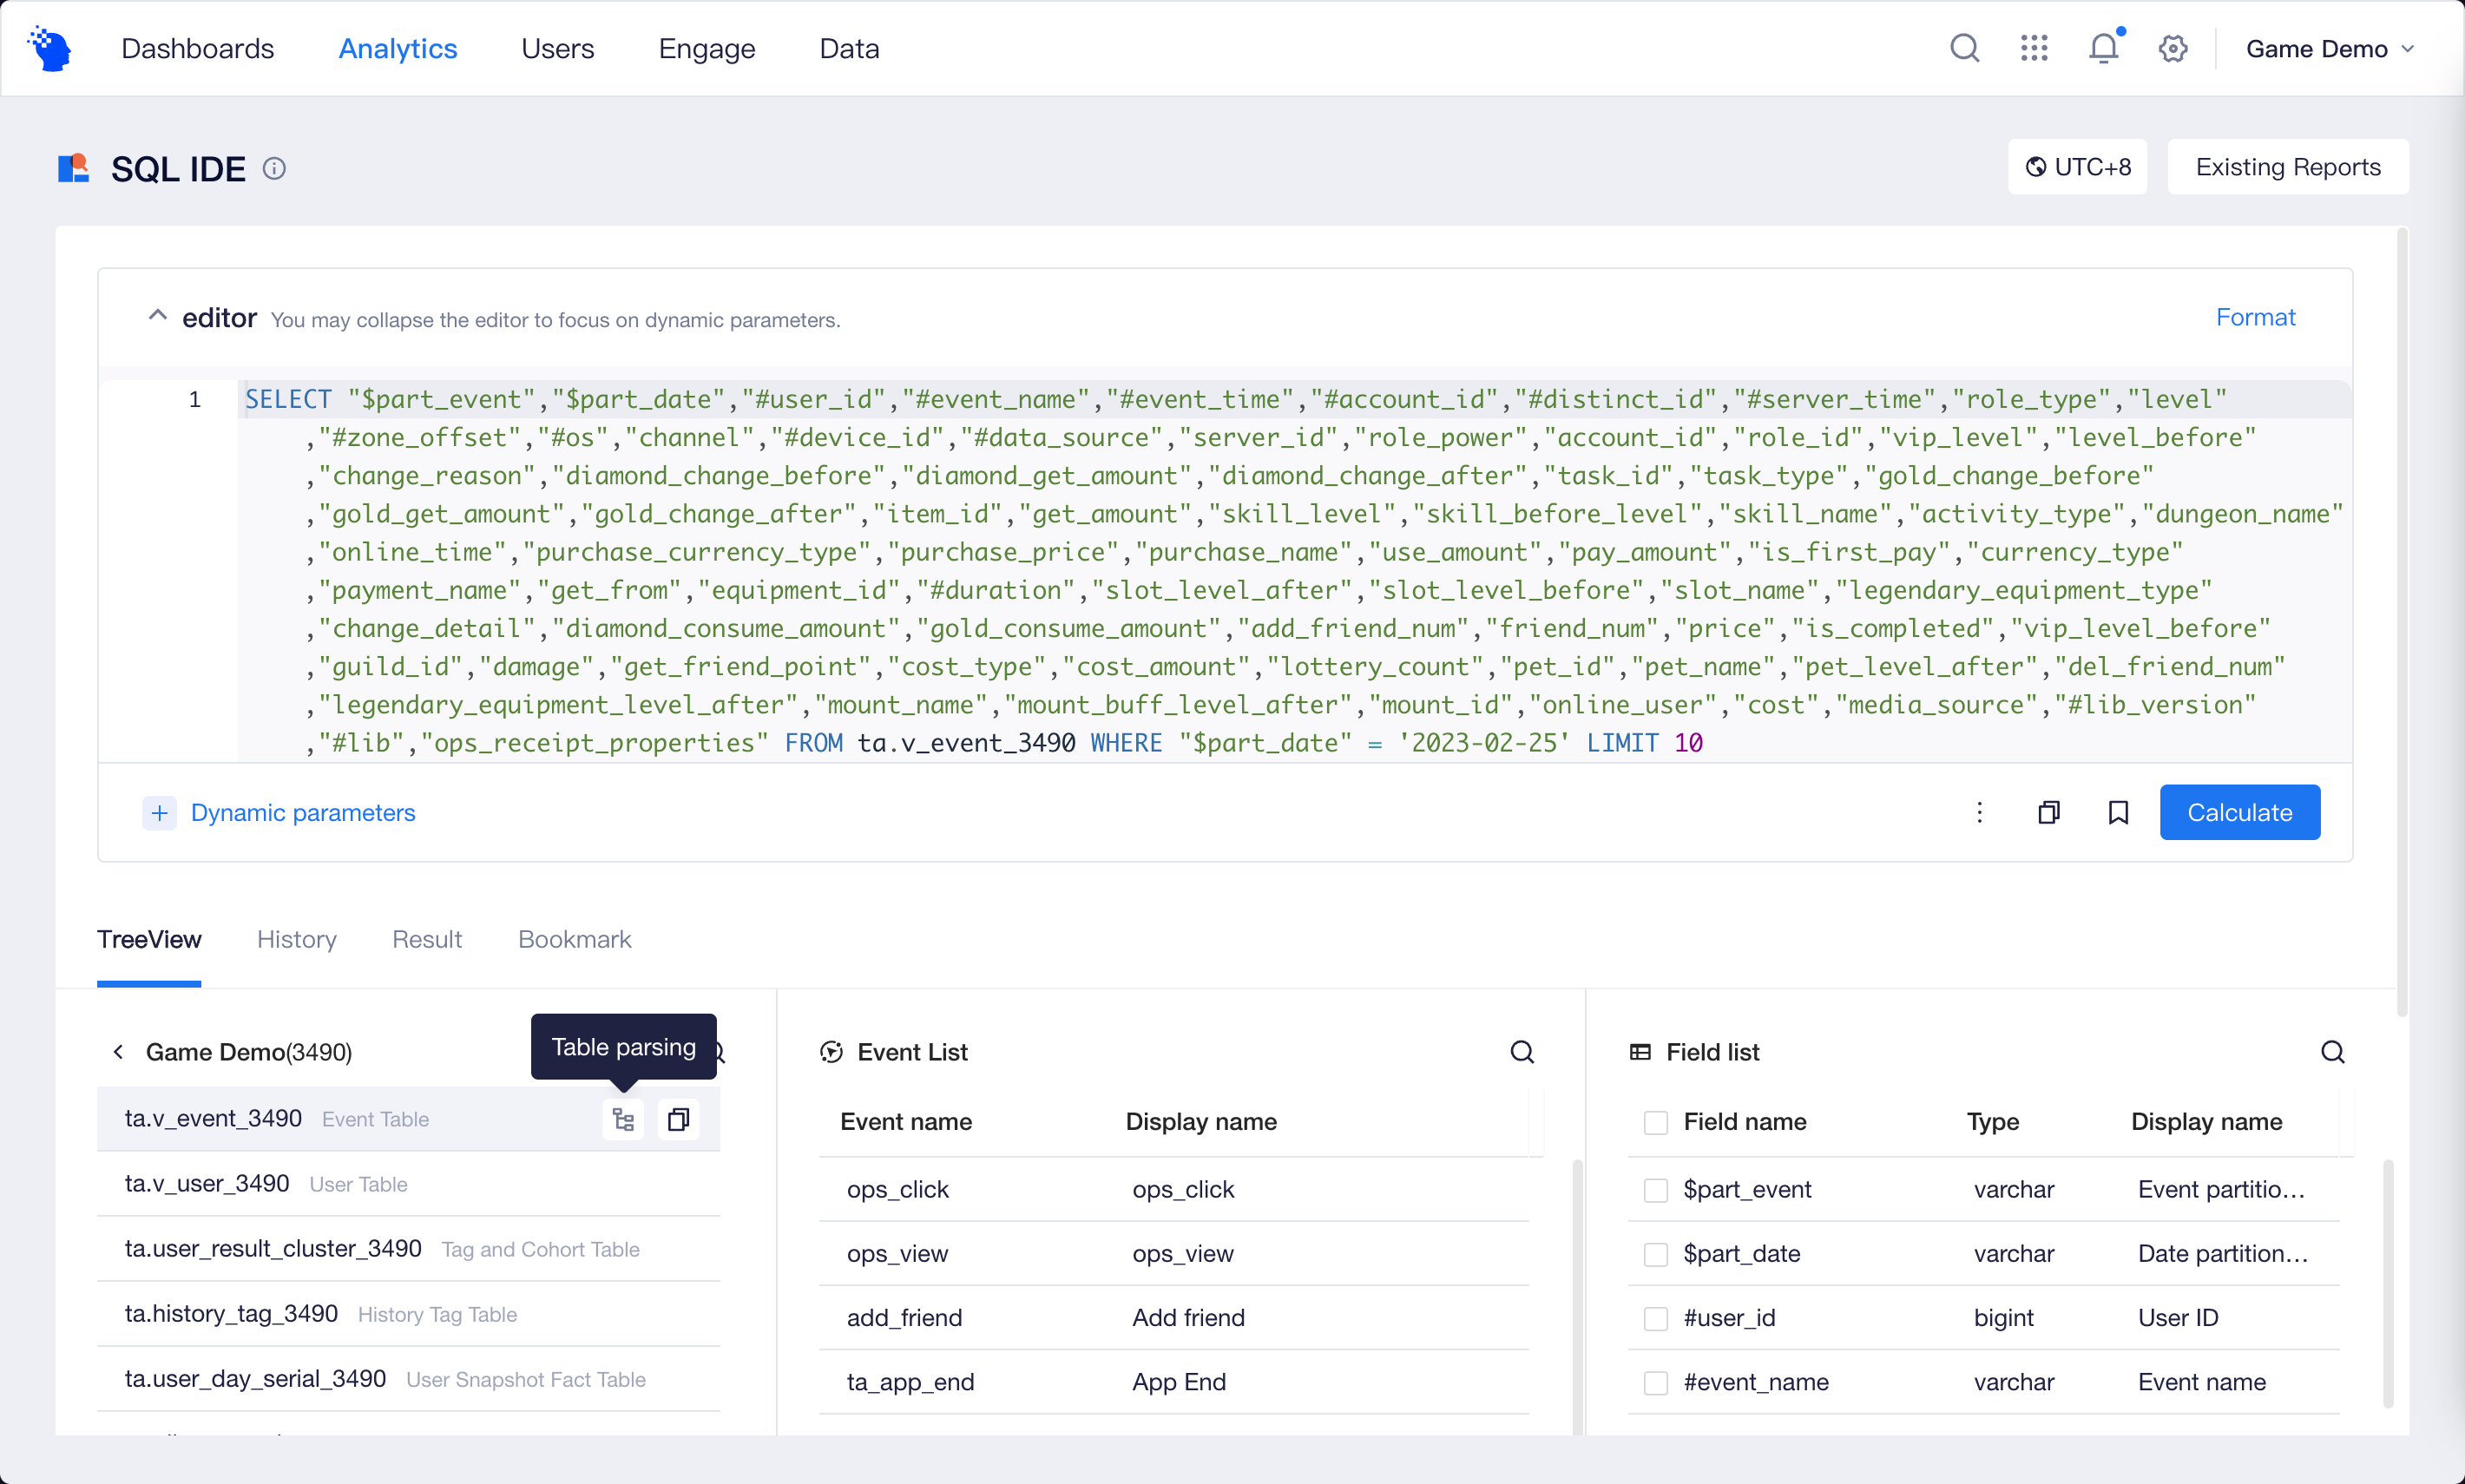
When compiling query statements, you can refer to information in the "table structure" to copy table names or field names within the table. You can also automatically insert query statements containing all fields into the input box through "table parsing".
You can also save the current content in the input box as a bookmark to avoid the loss of unfinished content. Saved bookmarks can be found in "Statement Bookmarks".
If you want to use Rolling in query statements or allow other members to dynamically adjust part of the content in query statements, you can add Dynamic Parameters.
Unlike in other analysis models, you can use data of all projects that you have permission on SQL queries. For example, you are able to simultaneously query DAUs of both projects 1 and 2:
SELECT
  a."$part_date"
, "Project_1_DAU"
, "Project_2_DAU"
FROM
  ((
   SELECT
     "$part_date"
   , count(DISTINCT "#user_id") "Project_1_DAU"
   FROM
     ta.v_event_1
   WHERE (("$part_date" BETWEEN '2023-01-01' AND '2023-01-07') AND ("$part_event" = 'login'))
   GROUP BY "$part_date"
)  a
INNER JOIN (
   SELECT
     "$part_date"
   , count(DISTINCT "#user_id") "Project_2_DAU"
   FROM
     ta.v_event_2
   WHERE (("$part_date" BETWEEN '2023-01-01' AND '2023-01-07') AND ("$part_event" = 'login'))
   GROUP BY "$part_date"
)  b ON (a."$part_date" = b."$part_date"))
ORDER BY a."$part_date" ASC
Apart from event and user tables, you can also use the following data in query statements:
- Tag and Cohort Table:
ta.user_result_cluster_{project_id} - History Tag Table:
ta.ta.history_tag_{project_id} - Historical exchange rate table:
ta_dim.ta_exchange - Dimension Table
- Project Temp Table
If you need to use the following data in query statements, you can contact your Customer Success Manager to learn more specific information.
- Save "User Snapshot Fact Table" at 0:00 every day to record and save users' status at the time.
- Import custom tables through Developer Tools.
- Use Trino Connectors to associate with external data sources
# View query results and save them as reports
After clicking the "Calculate" button, you can view the running results of the SQL statements. A maximum of 1,000 rows of detailed data can be displayed. If you need to view full data, please download the CSV file which supports a maximum of 1 million rows of data. You can also save the current query results as "Project Temp Table", which can be used in subsequent queries.
Apart from directly viewing data details, you can also display data through multiple chart forms provided by the Visualization Module, such as line graphs and pie charts. You can also save the current query statements and visualization configuration as a report and share it with other members.
Unlike in other model reports, data viewable to different members in an SQL report is also affected by data permissions. For example, members having only permissions of iOS channels can only view the behavior data of users from such channels.
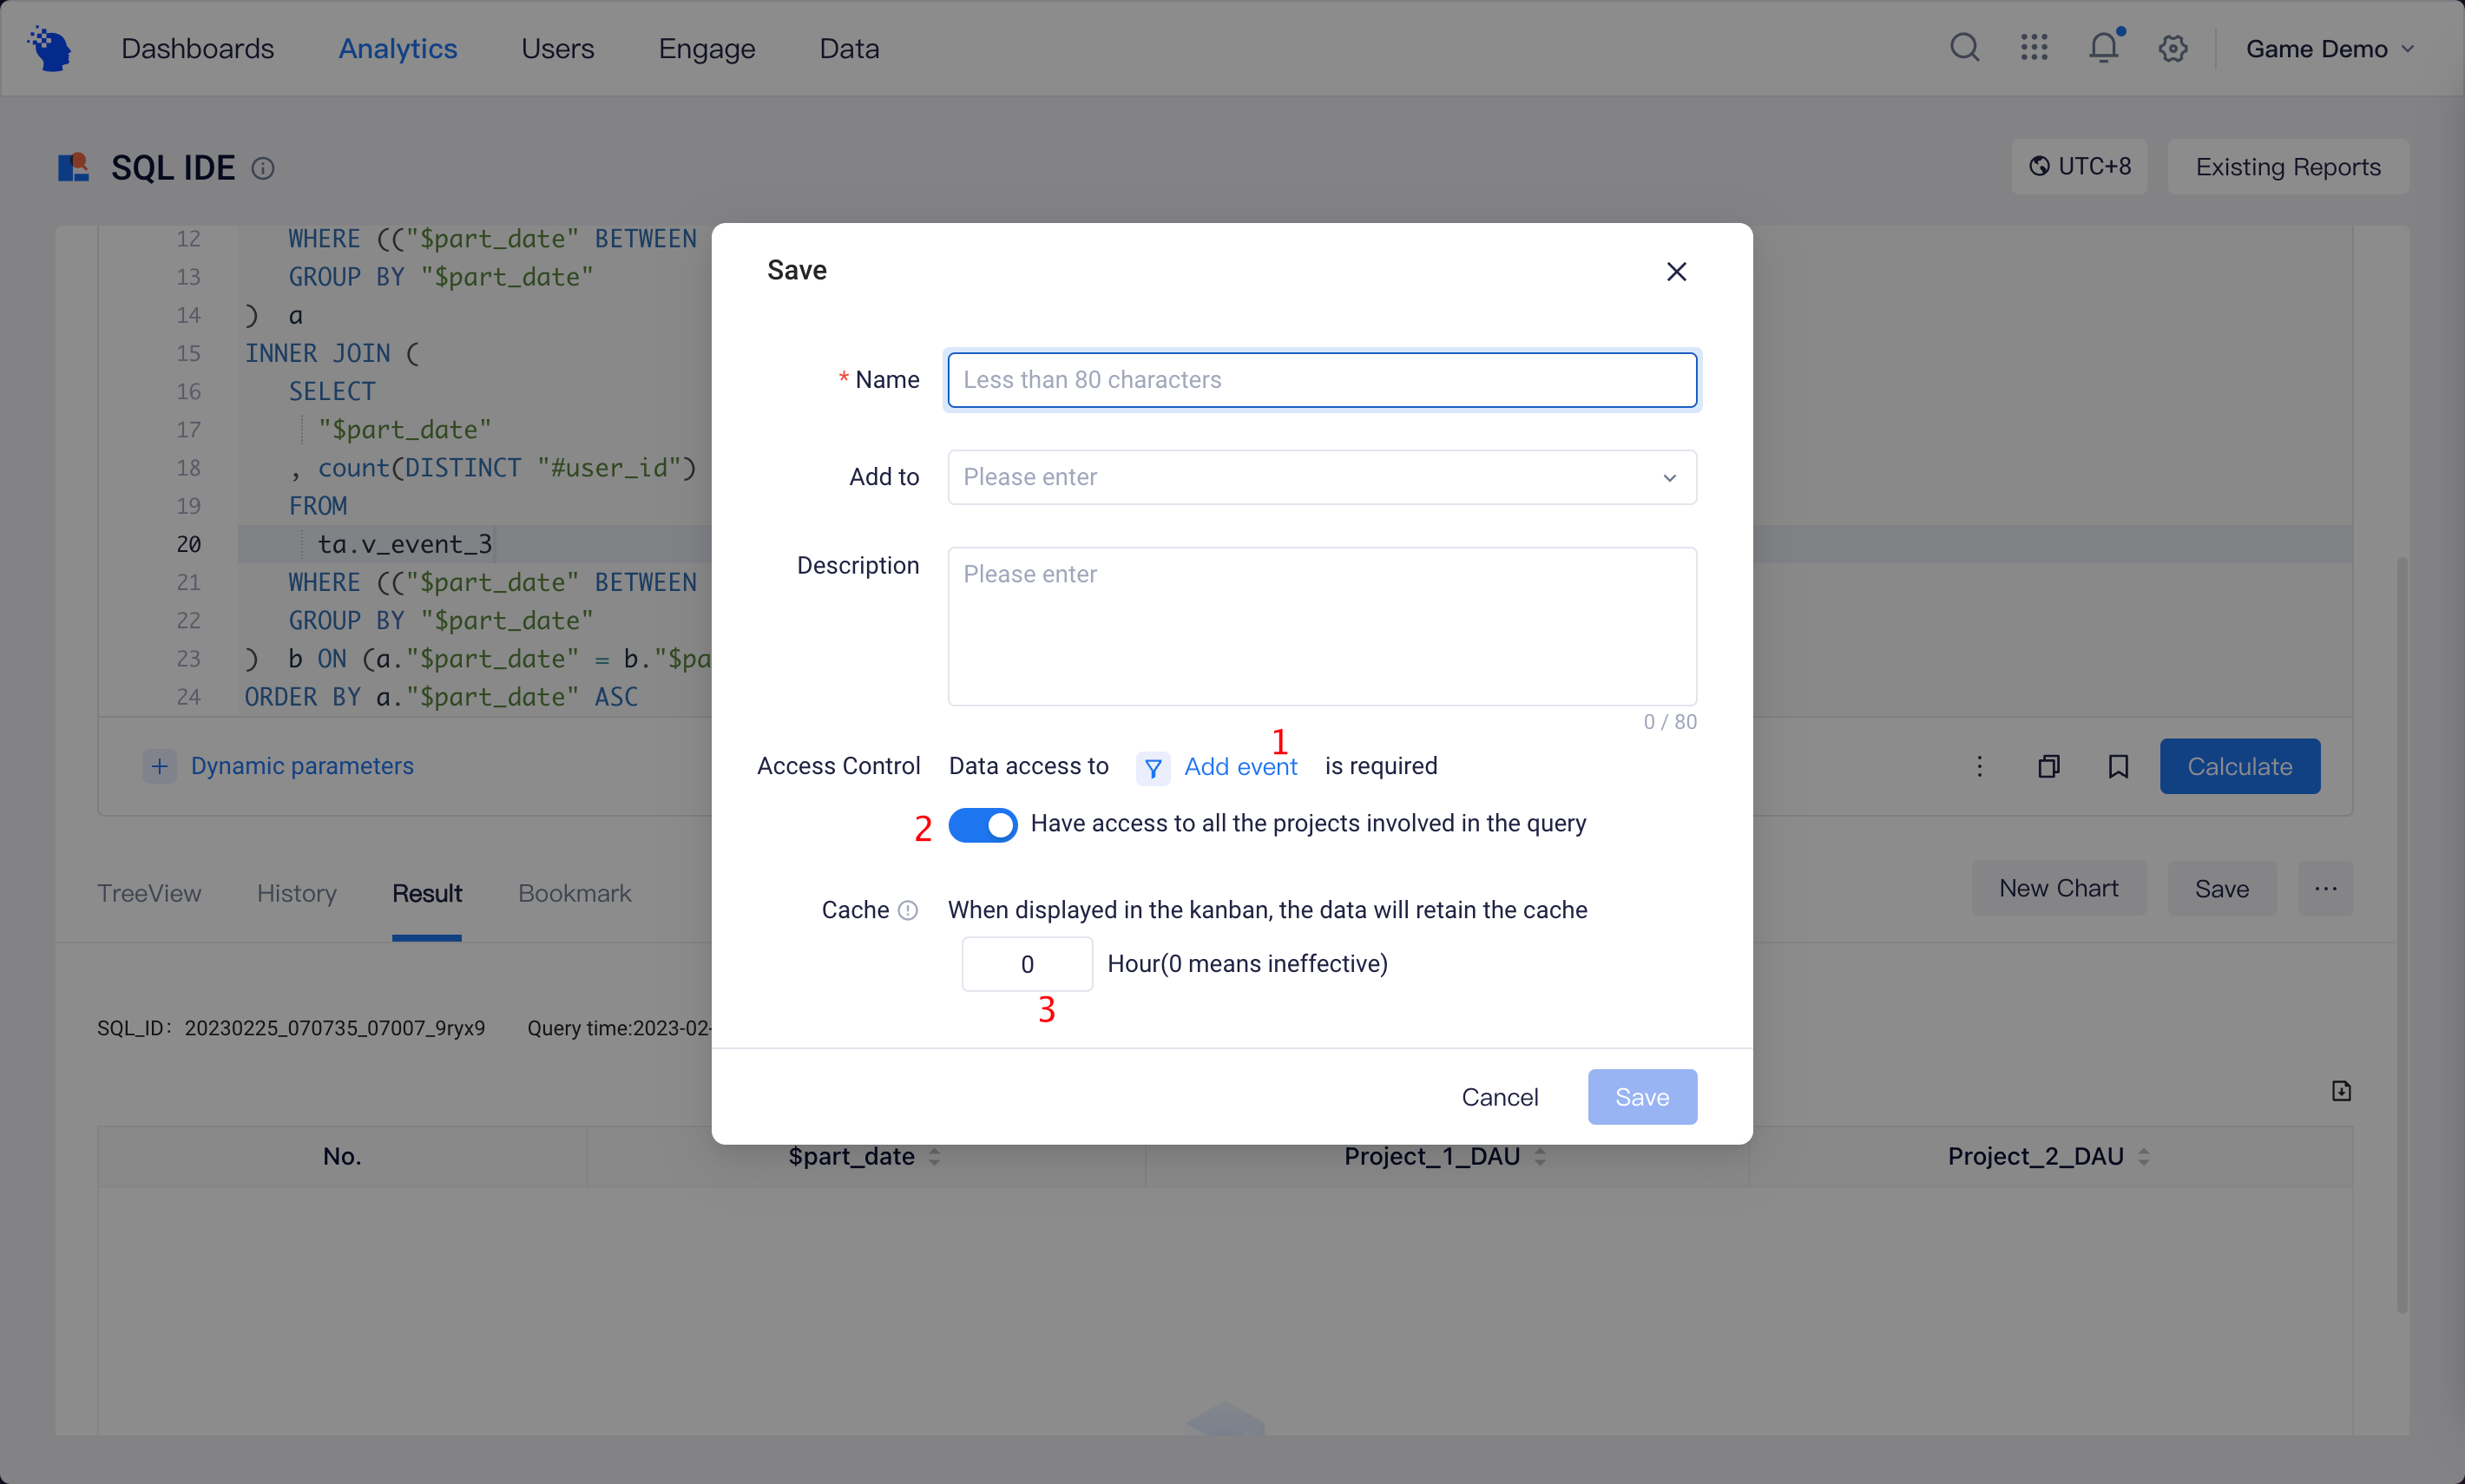
In addition to data permissions, you can also set event permissions for an SQL report. If a member does not have permission for the selected event, then no data will be displayed(1).
It should be noted that the report will only be saved under the current project regardless of whether query statements use data of other projects. If tables not falling in the current project appear in query statements, then you need to confirm whether the viewer has permission for all projects involved in the query(2).
Given the complexity of query statements in SQL reports, you can set the display cache to store the results of data computation(3). This saves the need for re-computation when subsequent queries involve the same reports as cached data results can be directly read, thus saving cluster resources.
Scheduled Update of the dashboard is effective to all SQL reports, and computation is initiated when the dashboard is updated regardless of its settings. You can set the cache of non-T+1 reports as 24 hours and enable the Periodical Update of the dashboard. This way, only one computation is needed a day.
If the execution duration of the query statements exceeds 300 seconds, then the dashboard cache must be set for the report. You can not manually refresh the report (as the dashboard is still effective during refreshing) nor can you access the Explore Module of the report. You may accelerate query speed by optimizing query statements or narrowing the range of data.