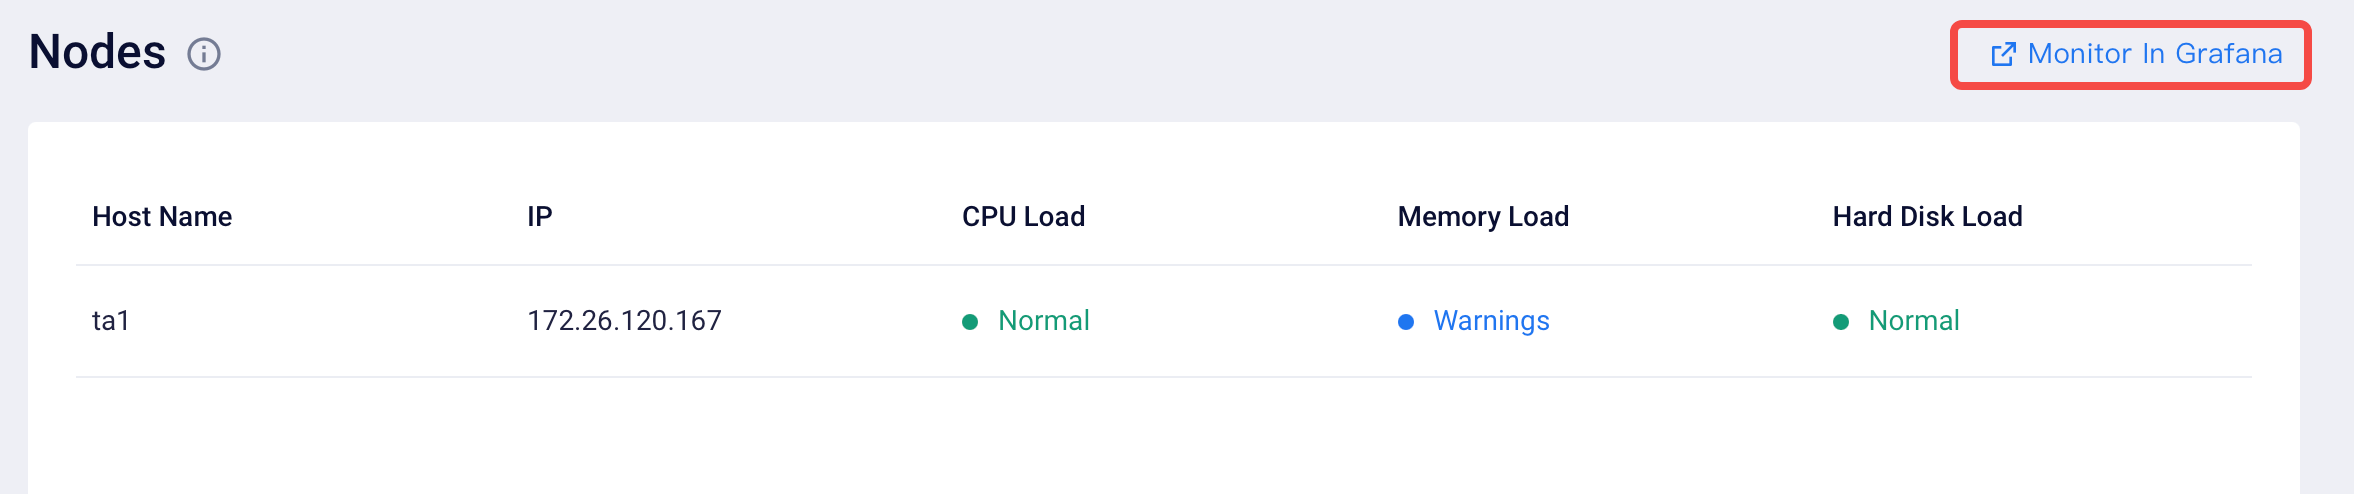
# Nodes Monitor
Use node monitoring to view the status of each host node in the current cluster, including CPU load, memory load, and hard disk load.
The status is divided into "Normal", "Warning", "Severe", "Critical", and the degree of urgency increases in turn. When "Severe" and "Critial" occur, your internal or TE operation and maintenance personnel may need to intervene.

When an exception occurs, you can click "Monitor in Grafana" in the upper right corner of the page to enter Grafana to view the performance dashboard.