# 디버깅
SDK로 데이터 액세스를 구현하는 중에, IDE 컨트롤러의 로그나 TE의 Debug 기능을 사용하여 디버깅할 수 있습니다.
# 1. SDK 로그 출력
로그를 활성화하면, IDE 내에서 ThinkingAnalytics 관련 로그를 필터링하여 SDK의 데이터 전송을 디버깅할 수 있습니다.
# 2. Debug 모드 시작
Debug 모드는 다음 2단계로 조작 가능합니다.
- 클라이언트에서 Debug 모드 시작
다음은 클라이언트에서 Debug 모드를 시작하는 코드 예시입니다:
[TDAnalytics enableLog:YES];
NSString *appid = @"AppId";
NSString *url = @"ServerUrl";

// SDK needs to be initialized on the main thread

// the second way
TDConfig *config = [[TDConfig alloc] init];
config.appid = appid;
config.configureURL = url;
/*
Set the operation mode as the Debug mode
NORMAL mode: the data would be saved in caches and reported according to relevant cache policies under the NORMAL mode by default. It is recommended to use the mode in an online environment
Debug mode: report data item by item. If problems occur, the user would be notified with logs and anomalies. It is recommended to use the Debug mode in an online environment
DebugOnly mode: data would be verified without being stored; it is not recommended to use the DebugOnly mode in an online environment
 */
config.mode = TDModeDebug;
[TDAnalytics startAnalyticsWithConfig:config];
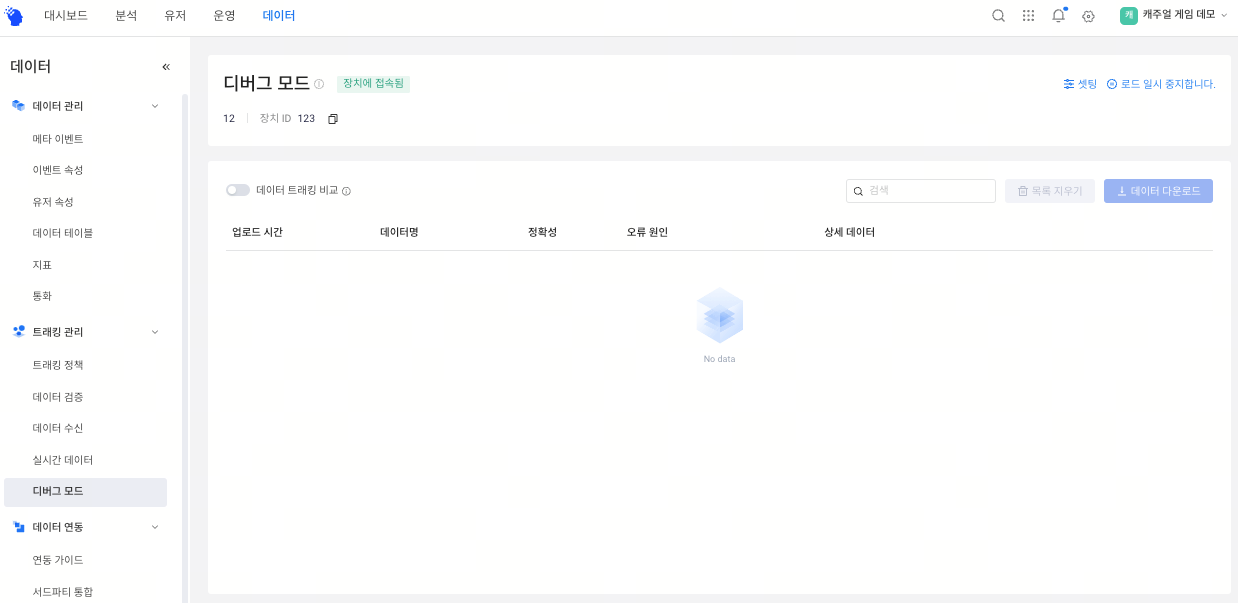
- TE 시스템 내에서 Debug 디바이스 추가
Debug 모드를 실제 환경에서 실수로 릴리스하는 것을 방지하기 위해, 특정 디바이스에서만 Debug 모드를 활성화할 수 있습니다.
클라이언트에서 Debug 모드를 시작하고, 디바이스 ID를 TE 시스템의 [데이터 관리] → [디버그 모드]에서 추가한 후 Debug 모드를 시작할 수 있습니다.
디바이스 ID는 다음 3가지 방법으로 획득 가능합니다.
- TE 시스템의 이벤트 데이터의 #device_id
- 클라이언트 로그: SDK 초기화 완료 후 출력된 DeviceId
- 호출을 통해 획득: 디바이스 ID 획득
Debug 모드는 데이터 수집의 질과 앱의 안정성에 영향을 미칩니다. 따라서 데이터 검증을 위해서만 사용해 주세요.