# デバッキング
TEのDebug機能を利用して、デバッキングを行えます。Debug機能は以下の2ステップで利用できます。
- DebugConsumerを使用
以下はDebugConsumerのコード例:
%% Reporting address configuration
ServerUrl = "server_url",
%% app_id configuration
AppID = "app_id",
%% Is the configuration written to the database?
IsWrite = true,
%% Configure device_id to view the reported data in real time on the TE backend.
DeviceId = "123456789",

%% init consumer
Consumer = td_debug_consumer:init_with_config(ServerUrl, AppID, IsWrite, DeviceId),
%% init SDK with consumer
TE_SDK = td_analytics:init_with_consumer(Consumer),

AccountId0 = "account_id_Erlang_0",

%% ordinary event
td_analytics:track_instance(TE_SDK, AccountId0, "distinct_logbus", "ViewProduct", #{"#key_1" => "🚓🦽🦼🚲🚜🚜🦽", "key_2" => 2.2, "key_array" => ["🚌", "🏍", "😚😊"]}),

%% When closing the SDK, it needs to be called. If you need to reopen the SDK after closing it, you must re-execute the initialization code mentioned above.
td_analytics:close_instance(TE_SDK).
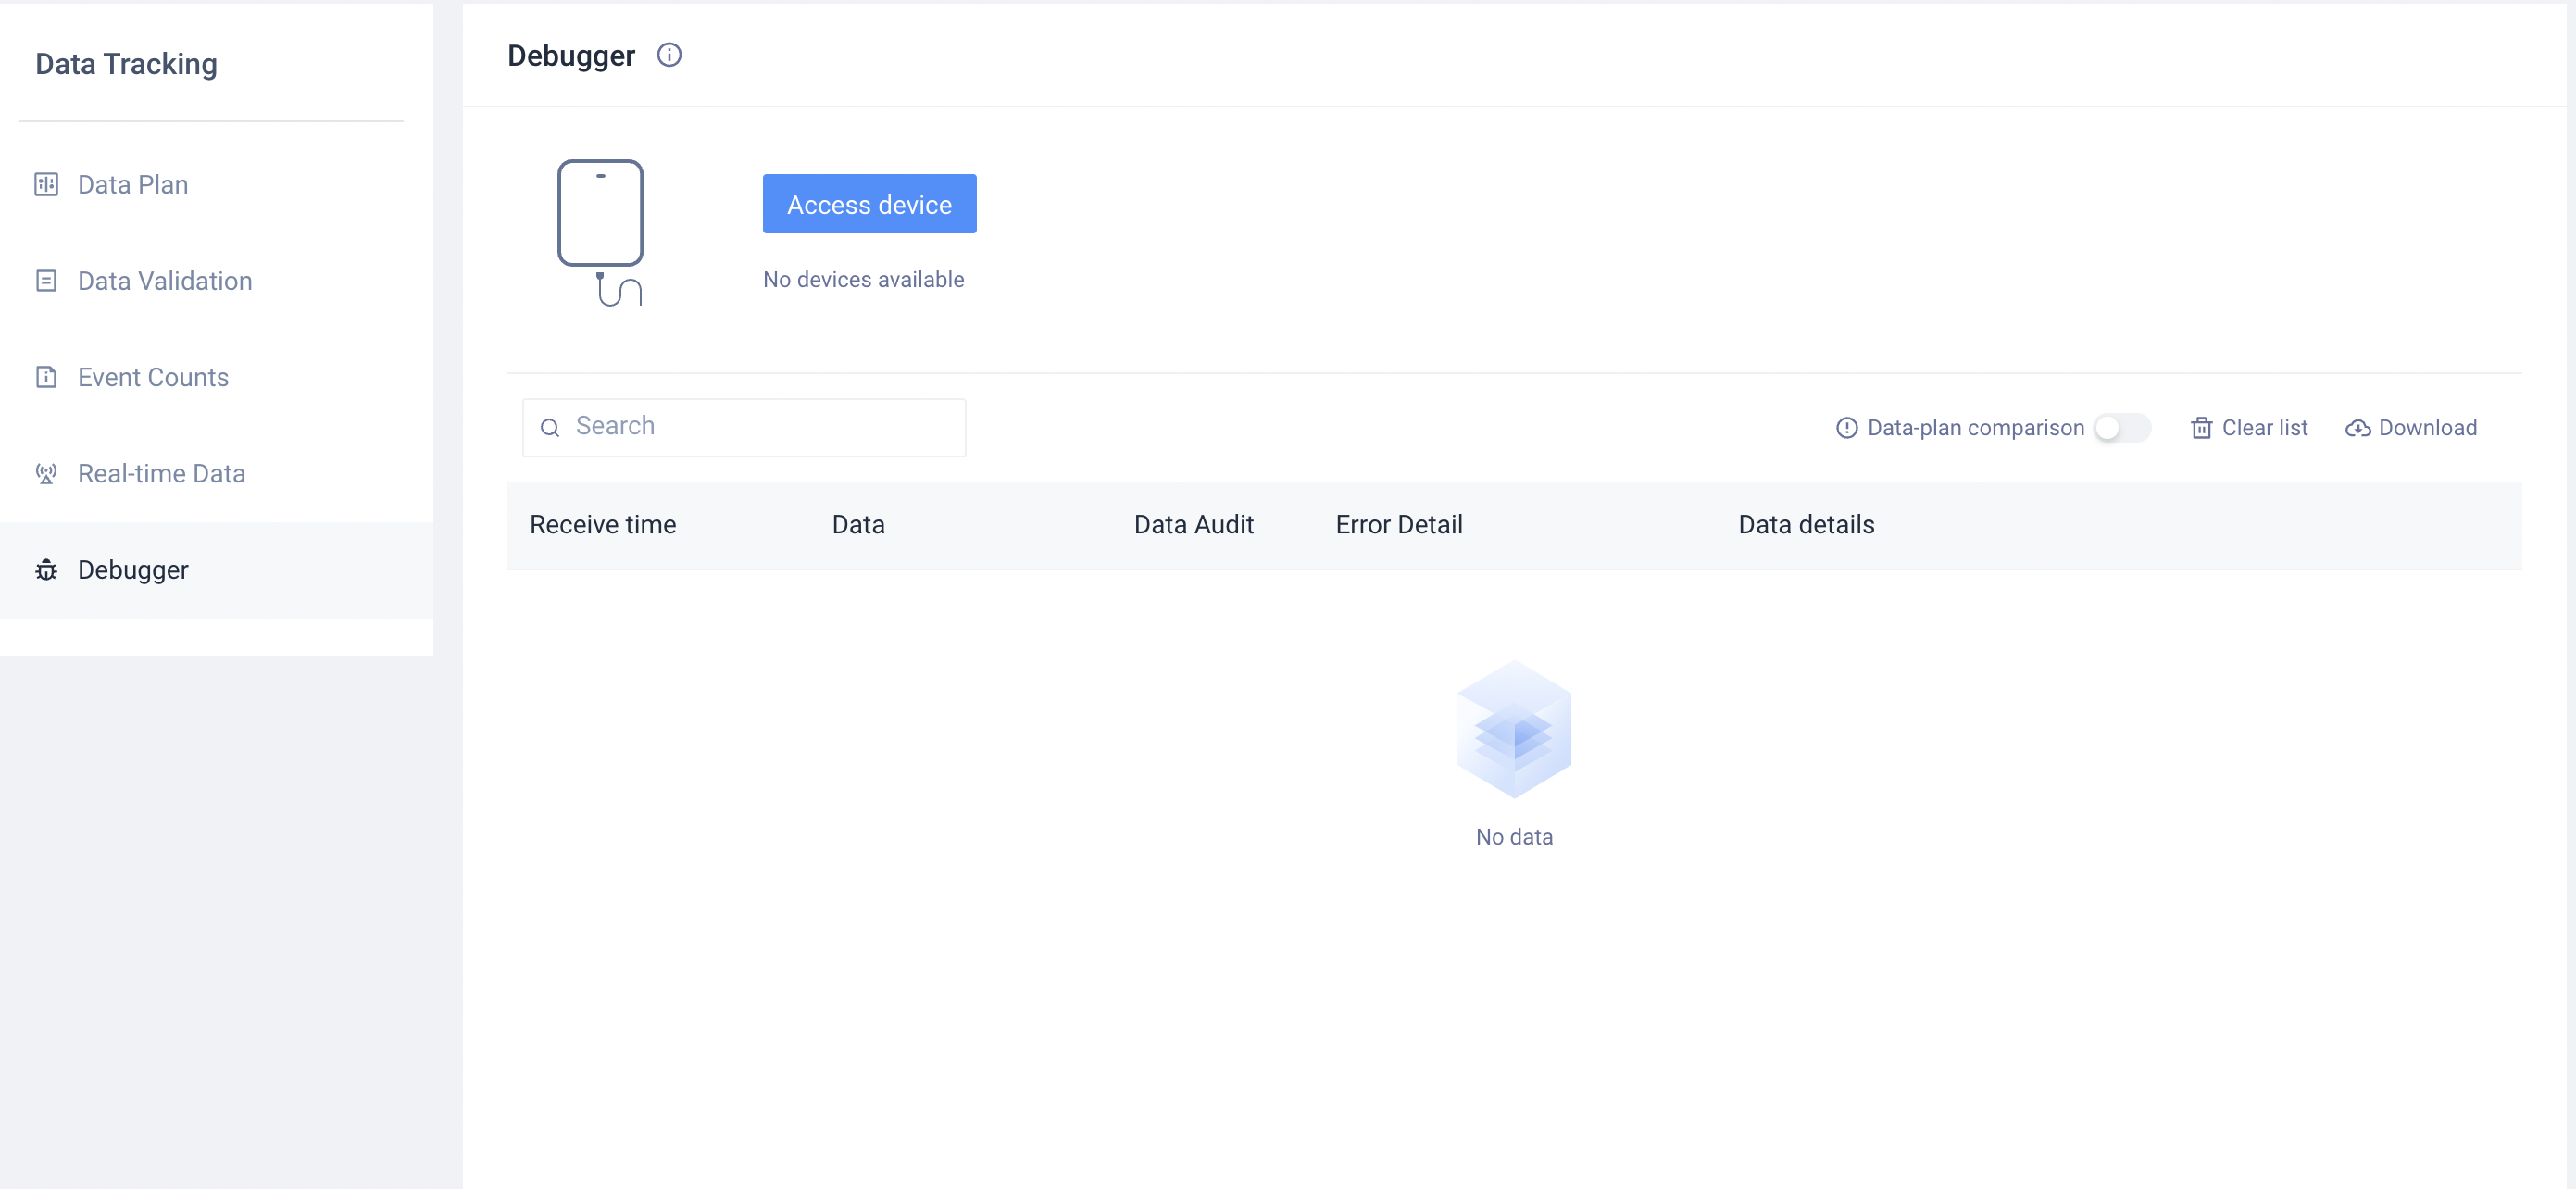
- TEシステム内でDebugデバイスを追加
Debugモードを本番環境でリリースしてしまうことを避けるため、特定のデバイスのみDebugモードが起動できます。
クライアントでDebugモードを起動し、デバイスIDをTEシステムの「データ管理」→「デバッグモード」で追加した上でDebugモードに起動できます。
Debugモードはデータ収集の質とAppの安定性に影響しますため、データ検証のみお使いください。
← リリース履歴 プリセットプロパティ →